Lamar County (/ləˈmɑːr/) is a county located in the U.S. state of Texas, in the Northeast Texas region. As of the 2020 census, its population was 50,088.[1] Its county seat is Paris.[2] The county was formed by the Congress of the Republic of Texas on December 17, 1840, and organized the next year.[3][4] It is named for Mirabeau B. Lamar, the second president of the Republic of Texas.[5] Lamar County comprises the Paris, TX micropolitan statistical area.
Lamar County | |
|---|---|
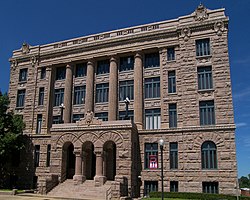
 The Lamar County Courthouse in Paris | |
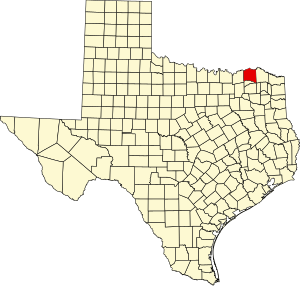
 Location within the U.S. state of Texas | |
 Texas's location within the U.S. | |
| Coordinates: 33°40′N 95°34′W / 33.67°N 95.57°W | |
| Country | |
| State | |
| Founded | 1841 |
| Named for | Mirabeau B. Lamar |
| Seat | Paris |
| Largest city | Paris |
| Area | |
• Total | 933 sq mi (2,420 km2) |
| • Land | 907 sq mi (2,350 km2) |
| • Water | 26 sq mi (70 km2) 2.8% |
| Population (2020) | |
• Total | 50,088 |
| • Density | 54/sq mi (21/km2) |
| Time zone | UTC−6 (Central) |
| • Summer (DST) | UTC−5 (CDT) |
| Congressional district | 4th |
| Website | www |
Geography
editAccording to the U.S. Census Bureau, the county has a total area of 933 square miles (2,420 km2), of which 907 square miles (2,350 km2) are land and 26 square miles (67 km2) (2.8%) are covered by water.[6]
Major highways
editAdjacent counties
edit- Choctaw County, Oklahoma (north)
- Red River County (east)
- Delta County (south)
- Fannin County (west)
- Bryan County, Oklahoma (northwest)
Communities
editCities
edit- Blossom
- Deport (partly in Red River County)
- Paris (county seat and largest municipality)
- Reno
- Roxton
- Sun Valley
- Toco
Census-designated place
editUnincorporated communities
editDemographics
edit| Census | Pop. | Note | %± |
|---|---|---|---|
| 1850 | 3,978 | — | |
| 1860 | 10,136 | 154.8% | |
| 1870 | 15,790 | 55.8% | |
| 1880 | 27,193 | 72.2% | |
| 1890 | 37,302 | 37.2% | |
| 1900 | 48,627 | 30.4% | |
| 1910 | 46,544 | −4.3% | |
| 1920 | 55,742 | 19.8% | |
| 1930 | 48,529 | −12.9% | |
| 1940 | 50,425 | 3.9% | |
| 1950 | 43,033 | −14.7% | |
| 1960 | 34,234 | −20.4% | |
| 1970 | 36,062 | 5.3% | |
| 1980 | 42,156 | 16.9% | |
| 1990 | 43,949 | 4.3% | |
| 2000 | 48,499 | 10.4% | |
| 2010 | 49,793 | 2.7% | |
| 2020 | 50,088 | 0.6% | |
| U.S. Decennial Census[7] 1850–2010[8] 2010–2020[9] | |||
| Race / Ethnicity (NH = Non-Hispanic) | Pop 2000[10] | Pop 2010[11] | Pop 2020[9] | % 2000 | % 2010 | % 2020 |
|---|---|---|---|---|---|---|
| White alone (NH) | 26,298 | 37,891 | 35,354 | 84.18% | 76.10% | 70.58% |
| Black or African American alone (NH) | 2,482 | 6,628 | 6,378 | 7.94% | 13.31% | 12.73% |
| Native American or Alaska Native alone (NH) | 234 | 592 | 751 | 0.75% | 1.19% | 1.50% |
| Asian alone (NH) | 81 | 304 | 474 | 0.26% | 0.61% | 0.95% |
| Pacific Islander alone (NH) | 7 | 5 | 25 | 0.02% | 0.01% | 0.05% |
| Other race alone (NH) | 14 | 27 | 119 | 0.04% | 0.05% | 0.24% |
| Mixed race or Multiracial (NH) | 373 | 1,123 | 2,575 | 1.19% | 2.26% | 5.14% |
| Hispanic or Latino (any race) | 1,753 | 3,223 | 4,412 | 5.61% | 6.47% | 8.81% |
| Total | 31,242 | 49,793 | 50,088 | 100.00% | 100.00% | 100.00% |
As of the census of 2000, 48,499 people, 19,077 households, and 13,468 families resided in the county.[12] At the tabulation of the 2020 United States census, its population increased to 50,088.[9]
Among the population, its racial and ethnic makeup was 70.58% non-Hispanic white, 12.73% Black or African American, 1.50% American Indian and Alaska Native, 0.95% Asian alone, 0.05% Native Hawaiian or other Pacific Islander, 0.24% some other race alone, 5.14% multiracial, and 8.81% Hispanic or Latino American of any race. In 2000, the racial makeup of the county was 82.46% White, 13.47% African American, 1.08% Native American, 0.40% Asian, 1.19% from other races, and 1.41% from two or more races. About 3.33% of the population was Hispanic or Latino of any race; from 2000 to 2020, the majority if its population remained predominantly non-Hispanic white against nationwide demographic trends of increased diversification.
Education
editThese school districts serve Lamar County:[13]
- Chisum ISD (small portion in Delta County)
- Fannindel ISD (mostly in Delta and Fannin Counties; small portion in Hunt County)
- Honey Grove ISD (mostly in Fannin County)
- North Lamar ISD
- Paris ISD
- Prairiland ISD (small portion in Red River County)
Until it closed in 2019,[14] Roxton ISD included a part of the county. Roxton ISD consolidated into Chisum ISD after the 2018–19 school year.[14]
In addition, Paris Junior College serves the county, as per the Texas Education Code.[15]
Politics
editThe majority-white population supported the Democratic Party well into the late 20th century, when it was nearly a one-party state, but in the early 21st century, most have shifted to the Republican Party. Lamar County is now represented in the Texas House of Representatives by Gary VanDeaver of New Boston.[16]
| Year | Republican | Democratic | Third party(ies) | |||
|---|---|---|---|---|---|---|
| No. | % | No. | % | No. | % | |
| 2024 | 17,044 | 80.08% | 4,079 | 19.16% | 162 | 0.76% |
| 2020 | 16,760 | 78.16% | 4,458 | 20.79% | 224 | 1.04% |
| 2016 | 14,561 | 77.81% | 3,583 | 19.15% | 570 | 3.05% |
| 2012 | 12,826 | 74.58% | 4,181 | 24.31% | 190 | 1.10% |
| 2008 | 12,952 | 70.54% | 5,243 | 28.55% | 167 | 0.91% |
| 2004 | 12,054 | 69.00% | 5,338 | 30.56% | 78 | 0.45% |
| 2000 | 9,775 | 63.35% | 5,553 | 35.99% | 102 | 0.66% |
| 1996 | 6,393 | 46.59% | 6,075 | 44.27% | 1,254 | 9.14% |
| 1992 | 5,778 | 35.57% | 6,328 | 38.96% | 4,137 | 25.47% |
| 1988 | 8,021 | 51.42% | 7,553 | 48.42% | 24 | 0.15% |
| 1984 | 9,273 | 62.57% | 5,504 | 37.14% | 43 | 0.29% |
| 1980 | 6,094 | 45.17% | 7,178 | 53.21% | 218 | 1.62% |
| 1976 | 4,443 | 33.98% | 8,601 | 65.78% | 32 | 0.24% |
| 1972 | 7,736 | 72.62% | 2,865 | 26.90% | 51 | 0.48% |
| 1968 | 3,395 | 31.05% | 4,635 | 42.39% | 2,903 | 26.55% |
| 1964 | 2,594 | 29.13% | 6,303 | 70.78% | 8 | 0.09% |
| 1960 | 3,964 | 43.68% | 5,084 | 56.02% | 28 | 0.31% |
| 1956 | 4,154 | 49.56% | 4,202 | 50.14% | 25 | 0.30% |
| 1952 | 3,929 | 41.56% | 5,524 | 58.44% | 0 | 0.00% |
| 1948 | 1,018 | 12.17% | 6,306 | 75.39% | 1,041 | 12.44% |
| 1944 | 725 | 9.36% | 6,283 | 81.10% | 739 | 9.54% |
| 1940 | 761 | 8.64% | 8,038 | 91.29% | 6 | 0.07% |
| 1936 | 308 | 5.19% | 5,621 | 94.65% | 10 | 0.17% |
| 1932 | 375 | 5.95% | 5,911 | 93.72% | 21 | 0.33% |
| 1928 | 2,887 | 57.08% | 2,163 | 42.76% | 8 | 0.16% |
| 1924 | 596 | 9.97% | 5,224 | 87.37% | 159 | 2.66% |
| 1920 | 639 | 12.76% | 3,765 | 75.21% | 602 | 12.03% |
| 1916 | 309 | 8.08% | 3,412 | 89.23% | 103 | 2.69% |
| 1912 | 206 | 7.47% | 2,286 | 82.89% | 266 | 9.64% |
See also
editReferences
edit- ^ "Lamar County, Texas". United States Census Bureau. Retrieved January 30, 2022.
- ^ "Find a County". National Association of Counties. Retrieved June 7, 2011.
- ^ "Texas: Individual County Chronologies". Texas Atlas of Historical County Boundaries. The Newberry Library. 2008. Retrieved June 20, 2015.
- ^ "Lamar County". Texas Almanac. Texas State Historical Association. May 22, 2015. Retrieved June 20, 2015.
- ^ Gannett, Henry (1905). The Origin of Certain Place Names in the United States. Government Printing Office. pp. 180.
- ^ "2010 Census Gazetteer Files". United States Census Bureau. August 22, 2012. Retrieved May 3, 2015.
- ^ "Decennial Census of Population and Housing by Decades". US Census Bureau.
- ^ "Texas Almanac: Population History of Counties from 1850–2010" (PDF). Texas Almanac. Archived (PDF) from the original on October 9, 2022. Retrieved May 3, 2015.
- ^ a b c "P2 Hispanic or Latino, and Not Hispanic or Latino by Race – 2020: DEC Redistricting Data (PL 94-171) – Lamar County, Texas". United States Census Bureau.
- ^ "P004: Hispanic or Latino, and Not Hispanic or Latino by Race – 2000: DEC Summary File 1 – Lamar County, Texas". United States Census Bureau.
- ^ "P2 Hispanic or Latino, and Not Hispanic or Latino by Race – 2010: DEC Redistricting Data (PL 94-171) – Lamar County, Texas". United States Census Bureau.
- ^ "U.S. Census website". United States Census Bureau. Retrieved May 14, 2011.
- ^ "2020 CENSUS - SCHOOL DISTRICT REFERENCE MAP: Lamar County, TX" (PDF). U.S. Census Bureau. Retrieved November 28, 2024. - Text list
- ^ a b "CONSOLIDATIONS, ANNEXATIONS AND NAME CHANGES FOR TEXAS PUBLIC SCHOOLS Updated January 28, 2020" (PDF). Texas Education Agency. Retrieved February 28, 2021.
- ^ Texas Education Code, Sec. 130.195. PARIS JUNIOR COLLEGE DISTRICT SERVICE AREA.
- ^ "Texas House of Representatives".
- ^ Leip, David. "Dave Leip's Atlas of U.S. Presidential Elections". uselectionatlas.org. Retrieved July 26, 2018.
External links
editMedia related to Lamar County, Texas at Wikimedia Commons
- Lamar County government's website
- Lamar County in Handbook of Texas Online at the University of Texas
- Historic Lamar County materials, hosted by the Portal to Texas History
- Lamar County Texas information - Lamar County Station