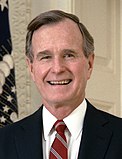
The 1992 United States presidential election in Vermont took place on November 3, 1992, as part of the 1992 United States presidential election. Voters chose three representatives, or electors to the Electoral College, who voted for president and vice president.
| |||||||||||||||||||||||||||||||||
| |||||||||||||||||||||||||||||||||
| |||||||||||||||||||||||||||||||||
| |||||||||||||||||||||||||||||||||
Vermont was won by Democratic Governor Bill Clinton of Arkansas, taking 46.11% of the popular vote over incumbent Republican President George H. W. Bush of Texas, who took 30.42%, a victory margin of 15.69%. Independent Texas billionaire Ross Perot finished in third, with 22.78% of the popular vote.[1] Clinton ultimately won the national vote, defeating incumbent President Bush.[2]
This election would prove to be a re-aligning one for the state of Vermont. Clinton's decisive double-digit victory in the state, including a Democratic sweep of all 14 counties, represented a dramatic turnaround for a state that had historically been known for being one of the most solidly Republican ones in the country. Since 1856, Vermont voted Republican in every presidential election except 1964, and was one of only two states (along with Maine) to vote against Franklin D. Roosevelt in all four of his presidential runs. As such, Clinton became only the second Democrat to ever carry Vermont in a presidential election, and the first non-incumbent Democrat to do so.
As of 2020, this is the only time that a Democratic presidential nominee carried Vermont without receiving a majority of the vote.
To date, this is the last time that the towns of Bakersfield, Northfield, and Wardsboro voted Republican.
Results
edit| 1992 United States presidential election in Vermont[1] | |||||
|---|---|---|---|---|---|
| Party | Candidate | Votes | Percentage | Electoral votes | |
| Democratic | Bill Clinton | 133,592 | 46.11% | 3 | |
| Republican | George H. W. Bush (incumbent) | 88,122 | 30.42% | 0 | |
| Independent | Ross Perot | 65,991 | 22.78% | 0 | |
| Libertarian | Andre Marrou | 501 | 0.17% | 0 | |
| Write-ins | 488 | 0.17% | 0 | ||
| New Alliance/Liberty Union[a] | Lenora Fulani | 429 | 0.15% | 0 | |
| Natural Law | Dr. John Hagelin | 315 | 0.11% | 0 | |
| VT Taxpayers' | Howard Phillips | 124 | 0.04% | 0 | |
| Socialist Workers | James Warren | 82 | 0.03% | 0 | |
| Democrats for Economic Recovery | Lyndon LaRouche | 57 | 0.02% | 0 | |
| Totals | 289,701 | 100.0% | 3 | ||
Results by county
edit| County | Bill Clinton Democratic |
George H.W. Bush Republican |
Ross Perot Independent |
Various candidates Other parties |
Margin | Total votes cast | |||||
|---|---|---|---|---|---|---|---|---|---|---|---|
| # | % | # | % | # | % | # | % | # | % | ||
| Addison | 8,092 | 47.53% | 5,034 | 29.57% | 3,777 | 22.18% | 123 | 0.72% | 3,058 | 17.96% | 17,026 |
| Bennington | 8,178 | 44.89% | 5,895 | 32.36% | 4,023 | 22.08% | 120 | 0.66% | 2,283 | 12.53% | 18,216 |
| Caledonia | 4,948 | 37.88% | 4,571 | 34.99% | 3,458 | 26.47% | 85 | 0.65% | 377 | 2.89% | 13,062 |
| Chittenden | 35,314 | 50.36% | 19,093 | 27.23% | 15,202 | 21.68% | 512 | 0.73% | 16,221 | 23.13% | 70,121 |
| Essex | 1,092 | 36.45% | 1,038 | 34.65% | 845 | 28.20% | 21 | 0.70% | 54 | 1.80% | 2,996 |
| Franklin | 8,004 | 42.69% | 5,484 | 29.25% | 5,146 | 27.44% | 117 | 0.62% | 2,520 | 13.44% | 18,751 |
| Grand Isle | 1,444 | 42.73% | 1,012 | 29.95% | 893 | 26.43% | 30 | 0.89% | 432 | 12.78% | 3,379 |
| Lamoille | 4,459 | 43.97% | 2,936 | 28.95% | 2,674 | 26.37% | 73 | 0.72% | 1,523 | 15.02% | 10,142 |
| Orange | 5,774 | 43.06% | 4,249 | 31.69% | 3,283 | 24.48% | 104 | 0.78% | 1,525 | 11.37% | 13,410 |
| Orleans | 4,721 | 41.01% | 3,572 | 31.03% | 3,135 | 27.23% | 85 | 0.74% | 1,149 | 9.98% | 11,513 |
| Rutland | 12,829 | 41.19% | 10,963 | 35.20% | 7,190 | 23.09% | 162 | 0.52% | 1,866 | 5.99% | 31,144 |
| Washington | 13,452 | 45.85% | 9,424 | 32.12% | 6,274 | 21.39% | 188 | 0.64% | 4,028 | 13.73% | 29,338 |
| Windham | 11,414 | 53.31% | 5,816 | 27.16% | 4,014 | 18.75% | 167 | 0.78% | 5,598 | 26.15% | 21,411 |
| Windsor | 13,871 | 47.52% | 9,035 | 30.95% | 6,077 | 20.82% | 209 | 0.72% | 4,836 | 16.57% | 29,192 |
| Totals | 133,592 | 46.11% | 88,122 | 30.42% | 65,991 | 22.78% | 1,996 | 0.69% | 45,470 | 15.69% | 289,701 |
Counties that flipped from Republican to Democratic
editSee also
editReferences
edit- ^ a b c "1992 Presidential General Election Results - Vermont". U.S. Election Atlas. Retrieved June 10, 2012.
- ^ "1992 Presidential General Election Results". U.S. Election Atlas. Retrieved June 10, 2012.
Notes
edit- ^ Fulani was a fusion candidate for the New Alliance and Liberty Union parties.[1]


