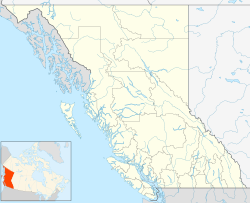
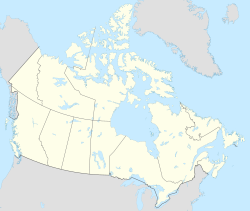
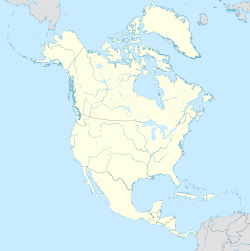
Sandspit (Haida: K'il Kun)[3] is the largest community on Moresby Island, in Haida Gwaii off the Pacific coast of British Columbia, Canada. The only town on Moresby Island, Sandspit has accommodations, a campground, supermarket and 85-berth harbour serving visitors to Gwaii Haanas National Park Reserve and Haida Heritage Site.[4]
Sandspit
K'il Kun | |
|---|---|
 The "Spirit of Sandspit" | |
| Coordinates: 53°15′N 131°49′W / 53.250°N 131.817°W[1] | |
| Country | Canada |
| Province | British Columbia |
| Region | Haida Gwaii |
| Regional district | North Coast |
| Area (2021)[2] | |
| • Land | 5.85 km2 (2.26 sq mi) |
| Elevation | 6 m (20 ft) |
| Population (2021)[2] | |
• Total | 310 |
| • Density | 53.0/km2 (137/sq mi) |
| Time zone | UTC−08:00 (PST) |
| Forward sortation area | |
| Area code(s) | 250, 778, 236 |
The unincorporated community had a population of 310 as of the 2021 census, up from 296 at the 2016 census.[2] The community is served by Sandspit Airport with daily flights to and from Vancouver, as well as multiple ferry voyages from Alliford Bay to Skidegate Landing on Graham Island.[4]
Near the airport is the "Spirit of Sandspit", a copper and cedar sculpture of a salmon, the "Spirit of Sandspit", by island artist Lon Sharp dominates the main road.[4] Sandspit is also home to the Open Ocean totem pole by Jesse Jones, Jimmy Jones and Jason Goetzinger.[5]
The Circle Tour leaves and returns to Sandspit on active gravel logging road past Skidegate Lake, Copper River, Gray Bay beach, and Copper Bay, where Haida people, continuing tradition, fish for sockeye salmon and hang the fish out to dry in May and early June to preserve it.[4]
Climate
editSandspit experiences an oceanic (Köppen Cfb) with a rainy season in the colder months, typical for the Pacific Northwest. It is very warm for its high latitude in North America, and its annual average temperature is the same as Port Hardy, which is located almost 3 degrees further south.[6]
| Climate data for Sandspit (Sandspit Airport) Climate ID: 1057050; coordinates 53°15′14″N 131°48′47″W / 53.25389°N 131.81306°W; elevation: 6.4 m (21 ft); 1991–2020 normals, extremes 1945−present[a] | |||||||||||||
|---|---|---|---|---|---|---|---|---|---|---|---|---|---|
| Month | Jan | Feb | Mar | Apr | May | Jun | Jul | Aug | Sep | Oct | Nov | Dec | Year |
| Record high humidex | 14.3 | 13.3 | 13.8 | 15.4 | 23.0 | 27.1 | 30.8 | 30.2 | 26.4 | 22.0 | 17.6 | 16.6 | 30.8 |
| Record high °C (°F) | 13.3 (55.9) |
13.4 (56.1) |
14.1 (57.4) |
18.9 (66.0) |
21.7 (71.1) |
26.7 (80.1) |
27.8 (82.0) |
26.7 (80.1) |
24.1 (75.4) |
20.6 (69.1) |
16.3 (61.3) |
13.4 (56.1) |
27.8 (82.0) |
| Mean daily maximum °C (°F) | 6.5 (43.7) |
6.6 (43.9) |
7.4 (45.3) |
9.7 (49.5) |
12.5 (54.5) |
15.0 (59.0) |
17.4 (63.3) |
18.2 (64.8) |
16.1 (61.0) |
12.3 (54.1) |
8.7 (47.7) |
6.7 (44.1) |
11.4 (52.5) |
| Daily mean °C (°F) | 4.1 (39.4) |
4.2 (39.6) |
4.5 (40.1) |
6.7 (44.1) |
9.7 (49.5) |
12.3 (54.1) |
14.7 (58.5) |
15.3 (59.5) |
13.2 (55.8) |
9.5 (49.1) |
6.1 (43.0) |
4.3 (39.7) |
8.7 (47.7) |
| Mean daily minimum °C (°F) | 1.8 (35.2) |
1.7 (35.1) |
1.6 (34.9) |
3.7 (38.7) |
6.8 (44.2) |
9.5 (49.1) |
11.9 (53.4) |
12.4 (54.3) |
10.3 (50.5) |
6.7 (44.1) |
3.5 (38.3) |
1.8 (35.2) |
6.0 (42.8) |
| Record low °C (°F) | −13.9 (7.0) |
−12.3 (9.9) |
−12.2 (10.0) |
−5.1 (22.8) |
−1.1 (30.0) |
2.2 (36.0) |
5.0 (41.0) |
1.9 (35.4) |
−0.6 (30.9) |
−3.1 (26.4) |
−15.5 (4.1) |
−12.8 (9.0) |
−15.5 (4.1) |
| Record low wind chill | −22.9 | −24.1 | −22.9 | −10.8 | −3.4 | 0.0 | 0.0 | 0.0 | 0.0 | −10.7 | −26.0 | −20.8 | −26.0 |
| Average precipitation mm (inches) | 166.9 (6.57) |
118.1 (4.65) |
118.1 (4.65) |
94.2 (3.71) |
54.2 (2.13) |
49.3 (1.94) |
48.6 (1.91) |
57.6 (2.27) |
78.3 (3.08) |
164.2 (6.46) |
175.3 (6.90) |
197.2 (7.76) |
1,322.1 (52.05) |
| Average rainfall mm (inches) | 157.9 (6.22) |
120.9 (4.76) |
116.5 (4.59) |
93.0 (3.66) |
57.6 (2.27) |
48.3 (1.90) |
48.0 (1.89) |
60.1 (2.37) |
78.9 (3.11) |
166.7 (6.56) |
180.8 (7.12) |
193.4 (7.61) |
1,322.1 (52.05) |
| Average snowfall cm (inches) | 12.0 (4.7) |
3.5 (1.4) |
6.5 (2.6) |
0.4 (0.2) |
0.0 (0.0) |
0.0 (0.0) |
0.0 (0.0) |
0.0 (0.0) |
0.0 (0.0) |
0.0 (0.0) |
1.6 (0.6) |
5.0 (2.0) |
28.9 (11.4) |
| Average precipitation days (≥ 0.2 mm) | 22.2 | 18.7 | 22.1 | 20.7 | 16.0 | 14.8 | 15.1 | 13.9 | 17.2 | 22.3 | 23.3 | 25.1 | 231.3 |
| Average rainy days (≥ 0.2 mm) | 21.1 | 17.8 | 21.1 | 20.2 | 16.2 | 14.8 | 15.0 | 14.4 | 17.3 | 22.6 | 23.2 | 24.0 | 227.6 |
| Average snowy days (≥ 0.2 cm) | 2.6 | 1.6 | 2.1 | 0.45 | 0.0 | 0.0 | 0.0 | 0.0 | 0.0 | 0.0 | 0.87 | 1.6 | 9.1 |
| Average relative humidity (%) (at 1500 LST) | 84.8 | 79.1 | 75.9 | 76.2 | 75.4 | 76.9 | 76.6 | 76.5 | 77.4 | 79.1 | 82.2 | 84.6 | 78.7 |
| Average dew point °C (°F) | 0.6 (33.1) |
1.8 (35.2) |
1.7 (35.1) |
3.6 (38.5) |
6.2 (43.2) |
8.8 (47.8) |
11.1 (52.0) |
11.9 (53.4) |
10.5 (50.9) |
7.2 (45.0) |
3.9 (39.0) |
1.9 (35.4) |
5.8 (42.4) |
| Mean monthly sunshine hours | 48.6 | 78.1 | 118.1 | 154.6 | 199.1 | 176.8 | 186.6 | 186.8 | 141.8 | 97.9 | 63 | 47 | 1,498.1 |
| Percent possible sunshine | 19.3 | 28.2 | 32.2 | 36.9 | 40.5 | 34.9 | 36.7 | 40.8 | 37.1 | 29.7 | 24.1 | 19.9 | 31.7 |
| Source: Environment and Climate Change Canada[6] (sunshine 1971–2000)[7] (dew point at 1300 LST, 1951–1980)[8] | |||||||||||||
Demographics
editIn the 2021 Canadian census conducted by Statistics Canada, Sandspit had a population of 310 living in 156 of its 243 total private dwellings, a change of 4.7% from its 2016 population of 296. With a land area of 5.85 km2 (2.26 sq mi), it had a population density of 53.0/km2 (137.2/sq mi) in 2021.[2]
Notes
edit- ^ Composite station metadata: Sandspit Airport AUTO; Climate ID: 1057051; WMO ID: 71101; coordinates 53°14′58″N 131°48′47″W / 53.24944°N 131.81306°W; 6.5 m (21 ft): Sandspit; Climate ID: 1057052; WMO ID: 71111; coordinates 53°15′15″N 131°48′50″W / 53.25417°N 131.81389°W; 6.4 m (21 ft): Sandspit AWOS; Climate ID: 1057055; coordinates 53°15′15″N 131°48′50″W / 53.25417°N 131.81389°W; 6.4 m (21 ft)
References
edit- ^ "Sandspit". Geographical Names Data Base. Natural Resources Canada.
- ^ a b c d "Census Profile, 2021 Census of Population Profile table: Sandspit, Unincorporated place (UNP) British Columbia [Designated place]". 1 February 2023. Retrieved 8 September 2024.
- ^ "Haida Gwaii" (PDF). Go Haida Gwaii. 2018. Retrieved 2 July 2020.
- ^ a b c d "Sandspit". Haida Gwaii. Haida Gwaii Observer. 2018. p. 26.
- ^ "The totem poles of Haida Gwaii". Haida Gwaii. Haida Gwaii Observer. 2018. p. 31.
- ^ a b "Canadian Climate Normals 1991–2020 Station Data". Environment and Climate Change Canada. 27 June 2024. Archived from the original on 12 April 2024. Retrieved 8 September 2024.
- ^ "Canadian Climate Normals 1971-2000 Station Data". Environment and Climate Change Canada. 27 June 2024. Archived from the original on 12 April 2024. Retrieved 8 September 2024.
- ^ "Canadian Climate Normals 1951–1980 Volume 8: Atmospheric, Pressure, Temperature and Humidity" (PDF). Environment and Climate Change Canada. Archived (PDF) from the original on 9 August 2023. Retrieved 8 September 2024.


