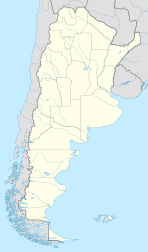
San José de Jáchal (Spanish pronunciation: [saŋ xoˈse ðe ˈxatʃal], often shortened to Jáchal) is a city in the northeast of the province of San Juan, Argentina, located on National Route 40, south of the Jáchal River. It has 21,018 inhabitants per the 2001 census [INDEC], and is the head town of the Jáchal Department.
San José de Jáchal | |
|---|---|
| Coordinates: 30°14′S 68°45′W / 30.233°S 68.750°W | |
| Country | |
| Province | |
| Department | Jáchal |
| Population (2001 census) | |
• Total | 21,018 |
| Time zone | UTC−3 (ART) |
| CPA base | J5460 |
| Dialing code | +54 2647 |
History
editSan José de Jáchal was founded on 25 June 1751 by the field master Juan de Echegaray, by the order of the Board of Populations of the Kingdom of Chile. That same month, through an interesting ceremony, the Villa de San José de Jáchal, forty leagues north of San Juan de la Frontera, was born to civilian and political life.
Geography
editClimate
edit| Climate data for San José de Jáchal (1991–2020, extremes 1961–present) | |||||||||||||
|---|---|---|---|---|---|---|---|---|---|---|---|---|---|
| Month | Jan | Feb | Mar | Apr | May | Jun | Jul | Aug | Sep | Oct | Nov | Dec | Year |
| Record high °C (°F) | 42.7 (108.9) |
41.5 (106.7) |
39.6 (103.3) |
38.3 (100.9) |
36.2 (97.2) |
35.5 (95.9) |
35.5 (95.9) |
36.5 (97.7) |
39.1 (102.4) |
39.9 (103.8) |
43.0 (109.4) |
45.3 (113.5) |
45.3 (113.5) |
| Mean daily maximum °C (°F) | 32.9 (91.2) |
31.2 (88.2) |
29.0 (84.2) |
24.5 (76.1) |
20.5 (68.9) |
18.5 (65.3) |
17.6 (63.7) |
20.4 (68.7) |
22.8 (73.0) |
26.9 (80.4) |
30.3 (86.5) |
32.7 (90.9) |
25.6 (78.1) |
| Daily mean °C (°F) | 25.4 (77.7) |
23.3 (73.9) |
21.0 (69.8) |
16.0 (60.8) |
11.2 (52.2) |
8.4 (47.1) |
7.2 (45.0) |
10.0 (50.0) |
13.5 (56.3) |
18.3 (64.9) |
22.0 (71.6) |
24.9 (76.8) |
16.8 (62.2) |
| Mean daily minimum °C (°F) | 16.6 (61.9) |
15.1 (59.2) |
13.0 (55.4) |
7.2 (45.0) |
2.6 (36.7) |
−1.0 (30.2) |
−2.4 (27.7) |
−0.6 (30.9) |
3.3 (37.9) |
7.8 (46.0) |
11.8 (53.2) |
15.2 (59.4) |
7.4 (45.3) |
| Record low °C (°F) | 3.9 (39.0) |
3.5 (38.3) |
−1.2 (29.8) |
−3.3 (26.1) |
−8.1 (17.4) |
−11.0 (12.2) |
−12.4 (9.7) |
−11.3 (11.7) |
−7.4 (18.7) |
−5.6 (21.9) |
−3.8 (25.2) |
0.0 (32.0) |
−12.4 (9.7) |
| Average precipitation mm (inches) | 18.6 (0.73) |
32.3 (1.27) |
16.0 (0.63) |
8.2 (0.32) |
5.7 (0.22) |
3.2 (0.13) |
3.4 (0.13) |
1.8 (0.07) |
5.4 (0.21) |
4.8 (0.19) |
5.9 (0.23) |
18.1 (0.71) |
123.4 (4.86) |
| Average precipitation days (≥ 0.1 mm) | 4.5 | 4.8 | 3.7 | 2.6 | 2.0 | 1.2 | 1.2 | 1.3 | 1.5 | 1.5 | 1.2 | 2.9 | 28.5 |
| Average snowy days | 0.0 | 0.0 | 0.0 | 0.1 | 0.1 | 0.1 | 0.6 | 0.4 | 0.3 | 0.0 | 0.0 | 0.0 | 1.6 |
| Average relative humidity (%) | 53.4 | 58.1 | 62.0 | 64.9 | 66.2 | 63.4 | 61.7 | 56.0 | 54.4 | 50.6 | 48.2 | 49.1 | 57.3 |
| Mean monthly sunshine hours | 285.2 | 240.1 | 220.1 | 192.0 | 179.8 | 174.0 | 195.3 | 226.3 | 225.0 | 269.7 | 294.0 | 306.9 | 2,808.4 |
| Mean daily sunshine hours | 9.2 | 8.5 | 7.1 | 6.4 | 5.8 | 5.8 | 6.3 | 7.3 | 7.5 | 8.7 | 9.8 | 9.9 | 7.7 |
| Percent possible sunshine | 69 | 69 | 63 | 67 | 61 | 53 | 61 | 68 | 63 | 68 | 66 | 66 | 65 |
| Source 1: Servicio Meteorológico Nacional[1][2][3] | |||||||||||||
| Source 2: UNLP (percent sun 1971–1980)[4] | |||||||||||||
References
edit- ^ "Estadísticas Climatológicas Normales - período 1991-2020" (in Spanish). Servicio Meteorológico Nacional. Retrieved 11 April 2023.
- ^ "Estadísticas Climatológicas Normales – período 1991–2020" (PDF) (in Spanish). Servicio Meteorológico Nacional. 2023. Archived from the original on 8 July 2023. Retrieved 1 August 2023.
- ^ "Clima en la Argentina: Guia Climática por Jachal". Caracterización: Estadísticas de largo plazo (in Spanish). Servicio Meteorológico Nacional. Retrieved 11 April 2023.
- ^ "Datos bioclimáticos de 173 localidades argentinas". Atlas Bioclimáticos (in Spanish). Universidad Nacional de La Plata. Retrieved July 4, 2016.
- Municipal information: Municipal Affairs Federal Institute (IFAM), Municipal Affairs Secretariat, Ministry of Interior, Argentina. (in Spanish)
