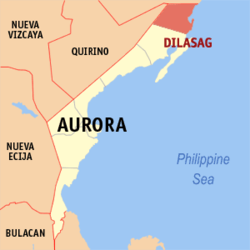
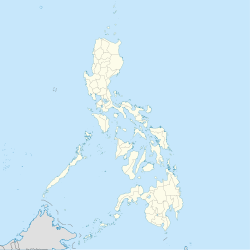
Dilasag [ˌdilɐˈsag], officially the Municipality of Dilasag (Tagalog/Kasiguranin: Bayan ng Dilasag; Ilocano: Ili ti Dilasag), is a municipality in the province of Aurora, Philippines. According to the 2020 census, it has a population of 17,102 people.[4]
Dilasag | |
|---|---|
| Municipality of Dilasag | |
| Nickname: Gateway to the Madre Valley | |
 Map of Aurora with Dilasag highlighted | |
Location within the Philippines | |
| Coordinates: 16°24′N 122°13′E / 16.4°N 122.22°E | |
| Country | Philippines |
| Region | Central Luzon |
| Province | Aurora |
| District | Lone district |
| Founded | 1959 |
| Barangays | 11 (see Barangays) |
| Government | |
| • Type | Sangguniang Bayan |
| • Mayor | Joe P. Gorospe |
| • Vice Mayor | Janice B. Villareal |
| • Representative | Rommel Rico T. Angara |
| • Municipal Council | Members |
| • Electorate | 11,250 voters (2022) |
| Area | |
• Total | 306.25 km2 (118.24 sq mi) |
| Elevation | 11.9 m (39.0 ft) |
| Population (2020 census)[4] | |
• Total | 17,102 |
| • Density | 56/km2 (140/sq mi) |
| • Households | 4,228 |
| Economy | |
| • Income class | 3rd municipal income class |
| • Poverty incidence | 21.41 |
| • Revenue | ₱ 139.1 million (2020) |
| • Assets | ₱ 232.1 million (2020) |
| • Expenditure | ₱ 116.9 million (2020) |
| • Liabilities | ₱ 23.25 million (2020) |
| Service provider | |
| • Electricity | Aurora Electric Cooperative (AURELCO) |
| Time zone | UTC+8 (PST) |
| ZIP code | 3205 |
| PSGC | |
| IDD : area code | +63 (0)42 |
| Native languages | Kasiguranin Ilocano Tagalog |
| Website | www |
History
editThis section needs additional citations for verification. (November 2016) |
The name "Dilasag" is divided into two syllables. The prefix Di in the native language[which?] means "abundance", added to the word lasag which means "meat". The coined word "Dilasag", however, does not only mean abundance of meat in the place, but also refers to the over sufficient supply of forest products, marine products and minerals.
In early 1924, a group of Ilocano settlers with a number of Kapampangans and Pangasinenses from Tarlac arrived in Casiguran, which was then part of Nueva Vizcaya.[6][7] Finding the natives unfriendly to them, the settlers moved along the coastline going north and settled finally to what is now called Dilasag. The place was considered habitable, because the native Dumagats in the place were friendly. Later, more families came, establishing a community. This community was soon recognized by the mayor of Casiguran, by then a municipality of Quezon. It was declared a sitio of barangay Culat and eventually a barrio of Casiguran in consideration of its rapid progress and development. In 1959, Quezon 1st District Representative Manuel Enverga introduced House Bill No. 2863 in the House of Representatives, resulting in the approval of Republic Act No. 2452 on June 21, 1959, making Dilasag a municipal district and separating it from Casiguran.[8] It was then part of the province of Quezon under the sub-province of Aurora until the latter became a province of its own in 1979.
Geography
editAccording to the Philippine Statistics Authority, the municipality has a land area of 306.25 square kilometres (118.24 sq mi) [9] constituting 9.73% of the 3,147.32-square-kilometre- (1,215.19 sq mi) total area of Aurora.
Dilasag is 142 kilometres (88 mi) from the provincial capital Baler and 373 kilometres (232 mi) from Manila.
Barangays
editDilasag is politically subdivided into 11 barangays.[10] Each barangay consists of puroks and some have sitios.
| PSGC | Barangay | Population | ±% p.a. | |||
|---|---|---|---|---|---|---|
| 2020[4] | 2010[11] | |||||
| 037703001 | Diagyan | 14.1% | 2,418 | 2,537 | −0.48% | |
| 037703002 | Dicabasan | 4.3% | 734 | 677 | 0.81% | |
| 037703003 | Dilaguidi | 5.4% | 915 | 1,015 | −1.03% | |
| 037703004 | Dimaseset | 8.3% | 1,420 | 1,408 | 0.08% | |
| 037703005 | Diniog | 14.5% | 2,485 | 2,331 | 0.64% | |
| 037703011 | Esperanza | 7.4% | 1,266 | 1,241 | 0.20% | |
| 037703006 | Lawang | 3.0% | 511 | 379 | 3.03% | |
| 037703007 | Maligaya (Poblacion) | 10.9% | 1,869 | 1,801 | 0.37% | |
| 037703008 | Manggitahan | 10.2% | 1,742 | 1,760 | −0.10% | |
| 037703009 | Masagana (Poblacion) | 10.8% | 1,841 | 1,822 | 0.10% | |
| 037703010 | Ura | 3.7% | 634 | 712 | −1.15% | |
| Total | 17,102 | 15,683 | 0.87% | |||
Climate
edit| Climate data for Dilasag, Aurora | |||||||||||||
|---|---|---|---|---|---|---|---|---|---|---|---|---|---|
| Month | Jan | Feb | Mar | Apr | May | Jun | Jul | Aug | Sep | Oct | Nov | Dec | Year |
| Mean daily maximum °C (°F) | 25 (77) |
26 (79) |
27 (81) |
30 (86) |
31 (88) |
30 (86) |
30 (86) |
30 (86) |
29 (84) |
28 (82) |
27 (81) |
25 (77) |
28 (83) |
| Mean daily minimum °C (°F) | 21 (70) |
21 (70) |
22 (72) |
23 (73) |
24 (75) |
24 (75) |
24 (75) |
24 (75) |
24 (75) |
23 (73) |
23 (73) |
22 (72) |
23 (73) |
| Average precipitation mm (inches) | 96 (3.8) |
77 (3.0) |
66 (2.6) |
59 (2.3) |
119 (4.7) |
133 (5.2) |
159 (6.3) |
143 (5.6) |
152 (6.0) |
243 (9.6) |
218 (8.6) |
200 (7.9) |
1,665 (65.6) |
| Average rainy days | 17.7 | 14.7 | 14.9 | 13.7 | 19.9 | 20.6 | 24.2 | 24.0 | 23.5 | 21.8 | 21.5 | 21.4 | 237.9 |
| Source: Meteoblue (modeled/calculated data, not measured locally)[12] | |||||||||||||
Demographics
edit| Year | Pop. | ±% p.a. |
|---|---|---|
| 1960 | 2,481 | — |
| 1970 | 5,995 | +9.21% |
| 1975 | 3,566 | −9.89% |
| 1980 | 6,716 | +13.49% |
| 1990 | 11,195 | +5.24% |
| 1995 | 12,825 | +2.58% |
| 2000 | 14,676 | +2.93% |
| 2007 | 14,833 | +0.15% |
| 2010 | 15,683 | +2.05% |
| 2015 | 15,835 | +0.18% |
| 2020 | 17,102 | +1.52% |
| Source: Philippine Statistics Authority[13][11][14][15] | ||
In the 2020 census, Dilasag had a population of 17,102.[4] The population density was 56 inhabitants per square kilometre (150/sq mi).
Economy
editPoverty incidence of Dilasag
10
20
30
40
2006
34.80 2009
19.15 2012
13.94 2015
12.39 2018
12.87 2021
21.41 Source: Philippine Statistics Authority[16][17][18][19][20][21][22][23] |
Tourism
editCoastal areas of Dilasag feature white sand beaches and fresh sea foods. With its mountainous terrain, Dilasag also provides an ideal venue for trekking and mountain-climbing.
- Canawer Beach
- Parang Hills
- Diniog Beach
- Mangrove Forest Park
- Singep Falls
The municipality is also home to the Amro River Protected Landscape.
References
edit- ^ Municipality of Dilasag | (DILG)
- ^ "2015 Census of Population, Report No. 3 – Population, Land Area, and Population Density" (PDF). Philippine Statistics Authority. Quezon City, Philippines. August 2016. ISSN 0117-1453. Archived (PDF) from the original on May 25, 2021. Retrieved July 16, 2021.
- ^ https://www.philatlas.com/luzon/r03/aurora/dilasag.html.
{{cite web}}: Missing or empty|title=(help) - ^ a b c d Census of Population (2020). "Region III (Central Luzon)". Total Population by Province, City, Municipality and Barangay. Philippine Statistics Authority. Retrieved 8 July 2021.
- ^ "PSA Releases the 2021 City and Municipal Level Poverty Estimates". Philippine Statistics Authority. 2 April 2024. Retrieved 28 April 2024.
- ^ An old map showing the current northern territory of Aurora as part of Nueva Vizcaya.
- ^ Mesina, Ilovita. "Baler And Its People, The Aurorans". Aurora.ph. Archived from the original on 11 October 2023. Retrieved 21 February 2018.
- ^ Republic Act No. 4785 (18 June 1966), "An Act Converting the Municipal District of Dilasag in the Subprovince of Aurora, Province of Quezon, into a Municipality", The Corpus Juris, archived from the original on 6 November 2016, retrieved 6 November 2016
- ^ "Province: Aurora". PSGC Interactive. Quezon City, Philippines: Philippine Statistics Authority. Retrieved 12 November 2016.
- ^ "Municipal: Dilasag". PSGC Interactive. Quezon City, Philippines: Philippine Statistics Authority. Retrieved 8 January 2016.
- ^ a b Census of Population and Housing (2010). "Region III (Central Luzon)" (PDF). Total Population by Province, City, Municipality and Barangay. National Statistics Office. Retrieved 29 June 2016.
- ^ "Dilasag, Aurora: Average Temperatures and Rainfall". Meteoblue. Retrieved 27 December 2018.
- ^ Census of Population (2015). "Region III (Central Luzon)". Total Population by Province, City, Municipality and Barangay. Philippine Statistics Authority. Retrieved 20 June 2016.
- ^ Censuses of Population (1903–2007). "Region III (Central Luzon)". Table 1. Population Enumerated in Various Censuses by Province/Highly Urbanized City: 1903 to 2007. National Statistics Office.
- ^ "Province of Aurora". Municipality Population Data. Local Water Utilities Administration Research Division. Retrieved 17 December 2016.
- ^ "Poverty incidence (PI):". Philippine Statistics Authority. Retrieved December 28, 2020.
- ^ "Estimation of Local Poverty in the Philippines" (PDF). Philippine Statistics Authority. 29 November 2005.
- ^ "2003 City and Municipal Level Poverty Estimates" (PDF). Philippine Statistics Authority. 23 March 2009.
- ^ "City and Municipal Level Poverty Estimates; 2006 and 2009" (PDF). Philippine Statistics Authority. 3 August 2012.
- ^ "2012 Municipal and City Level Poverty Estimates" (PDF). Philippine Statistics Authority. 31 May 2016.
- ^ "Municipal and City Level Small Area Poverty Estimates; 2009, 2012 and 2015". Philippine Statistics Authority. 10 July 2019.
- ^ "PSA Releases the 2018 Municipal and City Level Poverty Estimates". Philippine Statistics Authority. 15 December 2021. Retrieved 22 January 2022.
- ^ "PSA Releases the 2021 City and Municipal Level Poverty Estimates". Philippine Statistics Authority. 2 April 2024. Retrieved 28 April 2024.
External links
edit- Philippine Standard Geographic Code
- Dilasag on Aurora.ph


