The 1964 United States presidential election in Washington took place on November 3, 1964, as part of the 1964 United States presidential election. State voters chose nine[2] representatives, or electors, to the Electoral College, who voted for president and vice president.
| ||||||||||||||||||||||||||
| ||||||||||||||||||||||||||
 County results
| ||||||||||||||||||||||||||
| ||||||||||||||||||||||||||
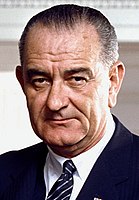
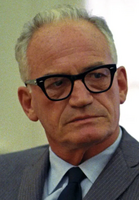
Washington was won by incumbent President Lyndon B. Johnson (D–Texas), with 61.97% of the popular vote, against Senator Barry Goldwater (R–Arizona), with 37.37% of the popular vote.[3][4] As of the 2020 presidential election[update], this is the last election in which Yakima County, Benton County, Grant County, Franklin County, Lewis County, Chelan County, Walla Walla County, Stevens County, Douglas County, Columbia County, and Garfield County voted for a Democratic presidential candidate.[5] This also remains the last time that a presidential nominee has carried the state with more than 60% of the vote.
Results
edit| Party | Candidate | Votes | % | |
|---|---|---|---|---|
| Democratic | Lyndon B. Johnson (incumbent) | 779,881 | 61.97% | |
| Republican | Barry Goldwater | 470,366 | 37.37% | |
| Socialist Labor | Eric Hass | 7,772 | 0.62% | |
| Socialist Workers | Clifton DeBerry | 537 | 0.04% | |
| Total votes | 1,258,556 | 100% | ||
Results by county
edit| County | Lyndon B. Johnson Democratic |
Barry Goldwater Republican |
Eric Hass Socialist Labor |
Clifton DeBerry Freedom Socialist |
Margin | Total votes cast[6] | |||||
|---|---|---|---|---|---|---|---|---|---|---|---|
| # | % | # | % | # | % | # | % | # | % | ||
| Adams | 2,027 | 47.44% | 2,241 | 52.45% | 2 | 0.05% | 3 | 0.07% | −214 | −5.01% | 4,273 |
| Asotin | 3,657 | 67.27% | 1,777 | 32.69% | 2 | 0.04% | 0 | 0.00% | 1,880 | 34.58% | 5,436 |
| Benton | 16,650 | 58.68% | 11,708 | 41.27% | 8 | 0.03% | 6 | 0.02% | 4,942 | 17.41% | 28,372 |
| Chelan | 10,295 | 57.77% | 7,406 | 41.56% | 111 | 0.62% | 10 | 0.06% | 2,889 | 16.21% | 17,822 |
| Clallam | 9,265 | 68.86% | 4,175 | 31.03% | 14 | 0.10% | 1 | 0.01% | 5,090 | 37.83% | 13,455 |
| Clark | 29,341 | 70.21% | 12,300 | 29.43% | 140 | 0.34% | 9 | 0.02% | 17,041 | 40.78% | 41,790 |
| Columbia | 1,138 | 52.03% | 1,048 | 47.92% | 1 | 0.05% | 0 | 0.00% | 90 | 4.11% | 2,187 |
| Cowlitz | 17,605 | 71.85% | 6,708 | 27.38% | 177 | 0.72% | 11 | 0.04% | 10,897 | 44.47% | 24,501 |
| Douglas | 3,728 | 58.47% | 2,643 | 41.45% | 2 | 0.03% | 3 | 0.05% | 1,085 | 17.02% | 6,376 |
| Ferry | 931 | 63.81% | 526 | 36.05% | 2 | 0.14% | 0 | 0.00% | 405 | 27.76% | 1,459 |
| Franklin | 6,375 | 63.38% | 3,615 | 35.94% | 66 | 0.66% | 2 | 0.02% | 2,760 | 27.44% | 10,058 |
| Garfield | 781 | 50.98% | 751 | 49.02% | 0 | 0.00% | 0 | 0.00% | 30 | 1.96% | 1,532 |
| Grant | 8,352 | 57.89% | 6,065 | 42.04% | 8 | 0.06% | 2 | 0.01% | 2,287 | 15.85% | 14,427 |
| Grays Harbor | 17,145 | 74.46% | 5,744 | 24.94% | 132 | 0.57% | 6 | 0.03% | 11,401 | 49.52% | 23,027 |
| Island | 3,946 | 56.38% | 3,044 | 43.49% | 8 | 0.11% | 1 | 0.01% | 902 | 12.89% | 6,999 |
| Jefferson | 3,012 | 67.59% | 1,432 | 32.14% | 8 | 0.18% | 4 | 0.09% | 1,580 | 35.45% | 4,456 |
| King | 268,216 | 59.52% | 177,598 | 39.41% | 4,535 | 1.01% | 291 | 0.06% | 90,618 | 20.11% | 450,640 |
| Kitsap | 26,904 | 71.34% | 10,702 | 28.38% | 105 | 0.28% | 3 | 0.01% | 16,202 | 42.96% | 37,714 |
| Kittitas | 5,383 | 62.65% | 3,200 | 37.24% | 4 | 0.05% | 5 | 0.06% | 2,183 | 25.41% | 8,592 |
| Klickitat | 3,819 | 67.31% | 1,850 | 32.60% | 4 | 0.07% | 1 | 0.02% | 1,969 | 34.71% | 5,674 |
| Lewis | 12,070 | 63.45% | 6,933 | 36.45% | 13 | 0.07% | 6 | 0.03% | 5,137 | 27.00% | 19,022 |
| Lincoln | 2,299 | 44.10% | 2,911 | 55.84% | 3 | 0.06% | 0 | 0.00% | −612 | −11.74% | 5,213 |
| Mason | 5,514 | 68.32% | 2,549 | 31.58% | 5 | 0.06% | 3 | 0.04% | 2,965 | 36.74% | 8,071 |
| Okanogan | 6,554 | 62.45% | 3,931 | 37.46% | 10 | 0.10% | 0 | 0.00% | 2,623 | 24.99% | 10,495 |
| Pacific | 5,056 | 73.70% | 1,789 | 26.08% | 13 | 0.19% | 2 | 0.03% | 3,267 | 47.62% | 6,860 |
| Pend Oreille | 1,978 | 66.71% | 985 | 33.22% | 1 | 0.03% | 1 | 0.03% | 993 | 33.49% | 2,965 |
| Pierce | 84,566 | 67.13% | 40,164 | 31.88% | 1,190 | 0.94% | 53 | 0.04% | 44,402 | 35.25% | 125,973 |
| San Juan | 906 | 51.77% | 839 | 47.94% | 4 | 0.23% | 1 | 0.06% | 67 | 3.83% | 1,750 |
| Skagit | 14,344 | 63.72% | 8,138 | 36.15% | 24 | 0.11% | 4 | 0.02% | 6,206 | 27.57% | 22,510 |
| Skamania | 1,758 | 72.83% | 653 | 27.05% | 3 | 0.12% | 0 | 0.00% | 1,105 | 45.78% | 2,414 |
| Snohomish | 55,013 | 67.58% | 25,902 | 31.82% | 467 | 0.57% | 23 | 0.03% | 29,111 | 35.76% | 81,405 |
| Spokane | 62,092 | 55.65% | 49,387 | 44.26% | 69 | 0.06% | 33 | 0.03% | 12,705 | 11.39% | 111,581 |
| Stevens | 4,266 | 56.29% | 3,302 | 43.57% | 9 | 0.12% | 1 | 0.01% | 964 | 12.72% | 7,578 |
| Thurston | 17,578 | 65.05% | 9,351 | 34.61% | 80 | 0.30% | 12 | 0.04% | 8,227 | 30.44% | 27,021 |
| Wahkiakum | 1,175 | 72.35% | 446 | 27.46% | 3 | 0.18% | 0 | 0.00% | 729 | 44.89% | 1,624 |
| Walla Walla | 9,481 | 53.89% | 8,102 | 46.05% | 9 | 0.05% | 2 | 0.01% | 1,379 | 7.84% | 17,594 |
| Whatcom | 20,297 | 64.59% | 10,900 | 34.69% | 207 | 0.66% | 18 | 0.06% | 9,397 | 29.90% | 31,422 |
| Whitman | 6,760 | 49.93% | 6,765 | 49.97% | 7 | 0.05% | 6 | 0.04% | −5 | −0.04% | 13,538 |
| Yakima | 29,604 | 56.14% | 22,786 | 43.21% | 326 | 0.62% | 14 | 0.03% | 6,818 | 12.93% | 52,730 |
| Totals | 779,881 | 61.97% | 470,366 | 37.37% | 7,772 | 0.62% | 537 | 0.04% | 309,515 | 24.60% | 1,258,556 |
Counties that flipped from Republican to Democratic
editSee also
editReferences
edit- ^ "United States Presidential election of 1964 - Encyclopædia Britannica". Retrieved May 29, 2017.
- ^ "1964 Election for the Forty-Fifth Term (1965-69)". Retrieved May 29, 2017.
- ^ "1964 Presidential General Election Results – Washington". Retrieved May 29, 2017.
- ^ "The American Presidency Project – Election of 1964". Retrieved May 29, 2017.
- ^ Sullivan, Robert David; ‘How the Red and Blue Map Evolved Over the Past Century’; America Magazine in The National Catholic Review; June 29, 2016.
- ^ a b Washington Secretary of State. "Presidential Candidates". Abstract of Votes Presidential and State General Election Held on November 3, 1964. Olympia, Washington. p. 2.

