The 1964 United States presidential election in Connecticut took place on November 3, 1964, as part of the 1964 United States presidential election, which was held throughout all 50 states and D.C. Voters chose eight representatives, or electors to the Electoral College, who voted for president and vice president.
| ||||||||||||||||||||||||||
| ||||||||||||||||||||||||||
| ||||||||||||||||||||||||||
| ||||||||||||||||||||||||||
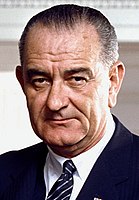
Connecticut voted overwhelmingly for the Democratic nominee, incumbent President Lyndon B. Johnson of Texas, over the Republican nominee, Senator Barry Goldwater of Arizona. Johnson ran with Senator Hubert H. Humphrey of Minnesota, while Goldwater's running mate was Congressman William E. Miller of New York.
Johnson carried Connecticut by a wide margin of 35.72%. His 67.81% vote share is the largest for a Democrat in Connecticut presidential election history, and the largest for any party since John Quincy Adams in 1828. He was the first Democrat to win every county since 1852.[1]
To date, this is the last time that the city of Shelton and the towns of Bethlehem, Goshen, Harwinton, Middlebury, New Fairfield, Oxford, and Somers voted Democratic.
Results
edit| 1964 United States presidential election in Connecticut[2] | |||||
|---|---|---|---|---|---|
| Party | Candidate | Votes | Percentage | Electoral votes | |
| Democratic | Lyndon B. Johnson (incumbent) | 826,269 | 67.81% | 8 | |
| Republican | Barry Goldwater | 390,996 | 32.09% | 0 | |
| Write-ins | Write-ins | 1,313 | 0.11% | 0 | |
| Totals | 1,218,578 | 100.00% | 8 | ||
By county
edit| County | Lyndon B. Johnson Democratic |
Barry Goldwater Republican |
Various candidates Other parties |
Margin | Total votes cast | ||||
|---|---|---|---|---|---|---|---|---|---|
| # | % | # | % | # | % | # | % | ||
| Fairfield | 194,782 | 60.75% | 125,576 | 39.17% | 261 | 0.08% | 69,206 | 21.58% | 320,619 |
| Hartford | 240,071 | 72.86% | 88,811 | 26.95% | 622 | 0.19% | 151,260 | 45.91% | 329,504 |
| Litchfield | 40,172 | 65.78% | 20,834 | 34.12% | 62 | 0.10% | 19,338 | 31.66% | 61,068 |
| Middlesex | 30,517 | 67.39% | 14,697 | 32.45% | 71 | 0.16% | 15,820 | 34.94% | 45,285 |
| New Haven | 218,743 | 69.10% | 97,656 | 30.85% | 171 | 0.05% | 121,087 | 38.25% | 316,570 |
| New London | 54,551 | 69.06% | 24,391 | 30.88% | 49 | 0.06% | 30,160 | 38.18% | 78,991 |
| Tolland | 22,195 | 68.92% | 9,951 | 30.90% | 58 | 0.18% | 12,244 | 38.02% | 32,204 |
| Windham | 25,238 | 73.50% | 9,080 | 26.44% | 19 | 0.06% | 16,158 | 47.06% | 34,337 |
| Totals | 826,269 | 67.81% | 390,996 | 32.09% | 1,313 | 0.10% | 435,273 | 35.72% | 1,218,578 |
Counties that flipped from Republican to Democratic
editSee also
editReferences
edit- ^ Thomas, G. Scott; The Pursuit of the White House: A Handbook of Presidential Election Statistics and History, p. 403 ISBN 0313257957
- ^ "1964 Presidential General Election Results - Connecticut". Dave Leip's Atlas of U.S. Presidential Elections. Retrieved February 7, 2013.


