| depression (SSHWS/NWS) | |
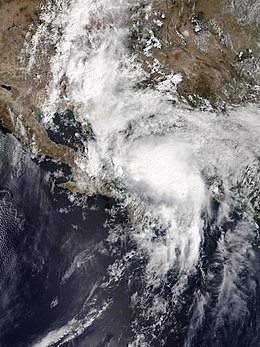
 Nineteen-E over the Gulf of California on September 19 | |
| Formed | September 19, 2018 |
|---|---|
| Dissipated | September 20, 2018 |
| Highest winds | 1-minute sustained: 35 mph (55 km/h) |
| Lowest pressure | 1002 mbar (hPa); 29.59 inHg |
| Fatalities | 7 |
| Damage | Unknown |
| Areas affected | Northern Mexico |
| Part of the 2018 Pacific hurricane season | |
Meteorological history
editOn September 10, the National Hurricane Center (NHC) began monitoring a region south of Mexico for potential tropical cyclone formation over later days.[1] A large area of disturbed weather formed south of the coastline four days later, and environmental conditions were expected to favor gradual development as it moved west or west-northwest.[2] Despite the light upper-level winds, formation odds were slowly scaled back beginning on September 16 owing to the disturbance's large size,[3] decreasing to a low chance two days later as the disturbance began interacting with Baja California.[4] The combination of high-resolution satellite imagery and surface observations early on September 19 indicated better definition to its low-level circulation,[5] and advisories were finally initiated on Tropical Depression Nineteen-E at 15:00 UTC that day.[6]
At the time of formation, Nineteen-E was characterized by deep convection organized into spiral bands east and north of the center, with upper-level outflow expanding in all directions but to the west.[7] Satellite-derived data indicated maximum winds of 35 mph (55 km/h) later on September 20, representing the depression's peak strength.[8] A mid- to upper-level trough moving across the western United States directed the system north and then northeast across the Gulf of California,[9] and it made landfall over Sonora between 04:00 UTC and 05:00 UTC on September 20. Once inland, the cyclone's convective pattern became more linear and it is deemed to have dissipated by 21:00 UTC that afternoon as the storm pushed inland over rough terrain.[10]
Preparations and impact
editIn the immediate aftermath of Tropical Depression Nineteen-E, the Mexican Army enacted Plan DN-III-E, readying personnel to assist in evacuations. Torrential rainfall, with a 24-hour peak of 14.1 inches (359 mm) in Ahome, caused water levels to rise to up to 3&nsbp;ft (1 m) within the city, with unconfirmed reports of nine people swept away by floodwaters. Los Mochis recorded 40 percent of its annual rainfall total, prompting the evacuation of 1,080 residents, cutting off roads as rushing water opened up tunnels, and weakening a local bridge. Nearby Culiacán similarly reported 30 percent of its annual rainfall amount from the tropical depression. Three communities in the municipality of El Fuerte were isolated by flooding, and water 0.8 ft (25 cm) above the roadways in Chihuahuita prevented the rescue of seven people. A truck with 12 passengers was trucked by a rising stream near the community of Higueras de Zaragoza. In Mocorito, a landslide destroyed a section of a railroad track, resulting in the derailment of a Descarrila train and rendering the area inaccesible by land. Four deaths were confirmed throughout Sinaloa, with three occurring in Culiacán and one in Ahome. Classes across the northern and central sections of the state were suspended as more than 350,000 homes were reported flooded. Temporary shelters were set up to accommodate nearly 2,000 people displaced across nine municipalities.
In Nogales, Sonora, 1.2 in (30 mm) of rainfall in just 20 minutes resulted in a rapidly-rising Arroyo Los Nogales river that swept away two people. A 2-year-old boy was also swept away by a stream in Obregon.
References
edit- ^ David A. Zelinsky (September 10, 2018). "Graphical Tropical Weather Outlook". Miami, Florida: National Hurricane Center. Retrieved September 21, 2018.
- ^ Eric S. Blake (September 14, 2018). "Graphical Tropical Weather Outlook". Miami, Florida: National Hurricane Center. Retrieved September 21, 2018.
- ^ John P. Cangialosi (September 16, 2018). "Graphical Tropical Weather Outlook". Miami, Florida: National Hurricane Center. Retrieved September 21, 2018.
- ^ John P. Cangialosi (September 16, 2018). "Graphical Tropical Weather Outlook". Miami, Florida: National Hurricane Center. Retrieved September 21, 2018.
- ^ David M. Roth; Eric S. Blake (September 16, 2018). "Graphical Tropical Weather Outlook". College Park, Maryland: Weather Prediction Center. Retrieved September 21, 2018.
- ^ David M. Roth; Eric S. Blake (September 19, 2018). Tropical Depression Nineteen-E Public Advisory Number 1 (Report). College Park, Maryland: Weather Prediction Center. Retrieved September 21, 2018.
- ^ David M. Roth; Eric S. Blake (September 19, 2018). Tropical Depression Nineteen-E Discussion Number 1 (Report). College Park, Maryland: Weather Prediction Center. Retrieved September 21, 2018.
- ^ Andrew Orrison; Eric S. Blake (September 19, 2018). Tropical Depression Nineteen-E Discussion Number 2 (Report). College Park, Maryland: Weather Prediction Center. Retrieved September 21, 2018.
- ^ John P. Cangialosi (September 20, 2018). Tropical Depression Nineteen-E Discussion Number 3 (Report). Miami, Florida: National Center Center. Retrieved September 21, 2018.
- ^ Robbie J. Berg (September 20, 2018). Remnants of Nineteen-E Discussion Number 4 (Report). Miami, Florida: National Center Center. Retrieved September 21, 2018.
External links
edit- The National Hurricane Center's advisory archive on Tropical Depression Nineteen-E