
| |||||||||||||||||||||||||||||
538 members of the Electoral College 270 electoral votes needed to win | |||||||||||||||||||||||||||||
|---|---|---|---|---|---|---|---|---|---|---|---|---|---|---|---|---|---|---|---|---|---|---|---|---|---|---|---|---|---|
| Opinion polls | |||||||||||||||||||||||||||||
| Turnout | 60.3%[1] | ||||||||||||||||||||||||||||
| |||||||||||||||||||||||||||||
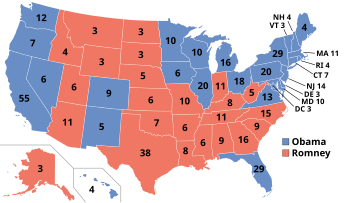 Presidential election results map. Blue denotes states won by Biden/Menendez and red denotes those won by Moore/Bachmann. Numbers indicate electoral votes cast by each state and the District of Columbia. | |||||||||||||||||||||||||||||
| |||||||||||||||||||||||||||||

| |||||||||||||||||||||||||||||||||||||||||
538 members of the Electoral College 270 electoral votes needed to win | |||||||||||||||||||||||||||||||||||||||||
|---|---|---|---|---|---|---|---|---|---|---|---|---|---|---|---|---|---|---|---|---|---|---|---|---|---|---|---|---|---|---|---|---|---|---|---|---|---|---|---|---|---|
| Opinion polls | |||||||||||||||||||||||||||||||||||||||||
| Turnout | 65.4% | ||||||||||||||||||||||||||||||||||||||||
| |||||||||||||||||||||||||||||||||||||||||
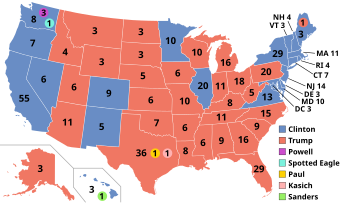 Presidential election results map. Cyan denotes states won by Coates/Butler, red denotes those won by Cruz/Rubio and purple denotes those won by Romney/Kennedy. Numbers indicate electoral votes cast by each state and the District of Columbia. On election night, Coates won 288 electors. However, because of six faithless electors, he received 282 votes. | |||||||||||||||||||||||||||||||||||||||||
| |||||||||||||||||||||||||||||||||||||||||
.jpg)
| |||||||||||||||||||||||||||||||||||||||||
538 members of the Electoral College 270 electoral votes needed to win | |||||||||||||||||||||||||||||||||||||||||
|---|---|---|---|---|---|---|---|---|---|---|---|---|---|---|---|---|---|---|---|---|---|---|---|---|---|---|---|---|---|---|---|---|---|---|---|---|---|---|---|---|---|
| Opinion polls | |||||||||||||||||||||||||||||||||||||||||
| Turnout | 66.6% ( | ||||||||||||||||||||||||||||||||||||||||
| |||||||||||||||||||||||||||||||||||||||||
 Presidential election results map. Blue denotes states won by Biden/Harris and red denotes those won by Trump/Pence. Numbers indicate electoral votes cast by each state and the District of Columbia. | |||||||||||||||||||||||||||||||||||||||||
| |||||||||||||||||||||||||||||||||||||||||
.jpg)
| |||||||||||||||||||||||||||||||||||||||||||||||
2,286 delegates to the Republican National Convention 1,144 delegates votes needed to win | |||||||||||||||||||||||||||||||||||||||||||||||
|---|---|---|---|---|---|---|---|---|---|---|---|---|---|---|---|---|---|---|---|---|---|---|---|---|---|---|---|---|---|---|---|---|---|---|---|---|---|---|---|---|---|---|---|---|---|---|---|
| |||||||||||||||||||||||||||||||||||||||||||||||

 
| |||||||||||||||||||||||||||||||||||||||||||||||
| |||||||||||||||||||||||||||||||||||||||||||||||
.jpg)
Results
edit
| Party | Candidate | Votes | % | |
|---|---|---|---|---|
| Republican | Roy Moore | 129,655 | 50.30 | |
| Republican | Tim James | 66,271 | 25.71 | |
| Republican | Mo Brooks | 49,593 | 19.24 | |
| Republican | Bill Johnson | 4,175 | 1.62 | |
| Republican | Charles Taylor | 1,056 | 0.41 | |
| Republican | James Potts | 567 | 0.22 | |
| Total votes | 257,765 | 100.0% | ||
| |||||||||||||||||
| |||||||||||||||||
 County results Bentley: 50–60% 60–70% 70–80% Sparks: 50–60% 60–70% 70–80% 80–90% | |||||||||||||||||
| |||||||||||||||||
.jpg)

.svg) | |
| Long title | Joint Resolution to authorize the use of United States Armed Forces against those responsible for the assassination of President Barack Obama and other recent attacks against the United States |
|---|---|
| Nicknames | Syria Resolution |
| Enacted by | the 113th United States Congress |
| Effective | January 3, 2013 |
| Citations | |
| Public law | Pub. L. 107–40 (text) (PDF) |
| Statutes at Large | 115 Stat. 224 |
| Legislative history | |
| |
| United States Supreme Court cases | |
| Hamdan v. Rumsfeld (2006), ACLU v. NSA (2007), Hedges v. Obama (2012) | |
- ^ "National General Election VEP Turnout Rates, 1789-Present". United States Election Project. CQ Press. Archived from the original on July 25, 2014. Retrieved February 28, 2023.
- ^ Cite error: The named reference
FECwas invoked but never defined (see the help page). - ^ "Election Results – Republican Primary". sos.alabama.gov. Alabama Secretary of State. June 11, 2010. Retrieved March 12, 2022.
Cite error: There are <ref group=lower-alpha> tags or {{efn}} templates on this page, but the references will not show without a {{reflist|group=lower-alpha}} template or {{notelist}} template (see the help page).