|
|
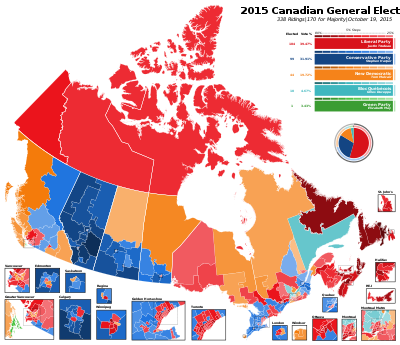
First party
|
Second party
|
Third party
|
|
|
|
|
|
| Leader
|
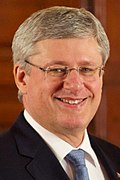
Stephen Harper
|
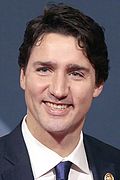
Justin Trudeau
|
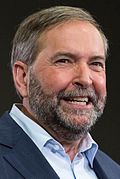
Tom Mulcair
|
| Party
|
Conservative
|
Liberal
|
New Democratic
|
| Leader since
|
March 20, 2004
|
April 14, 2013
|
March 24, 2012
|
| Leader's seat
|
Calgary Heritage
|
Papineau
|
Outremont
|
| Last election
|
166 seats, 39.62%
|
34 seats, 18.91%
|
103 seats, 30.63%
|
| Seats before
|
159
|
36
|
95
|
| Seats won
|
135
|
113
|
83
|
| Seat change
|
 24 24
|
 77 77
|
 12 12
|
| Popular vote
|
5,954,711
|
4,832,376
|
4,172,696
|
| Percentage
|
31.85%
|
27.47%
|
23.72%
|
| Swing
|
 5.77pp 5.77pp
|
 8.56pp 8.56pp
|
 6.91pp 6.91pp
|
|
|
|
Fourth party
|
Fifth party
|
|
|
|
|
| Leader
|
Elizabeth May
|
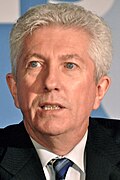
Gilles Duceppe
|
| Party
|
Green
|
Bloc Québécois
|
| Leader since
|
August 27, 2006
|
June 10, 2015
|
| Leader's seat
|
Saanich—Gulf Islands
|
Ran in Laurier—Sainte-Marie (lost)
|
| Last election
|
1 seat, 3.91%
|
4 seats, 6.04%
|
| Seats before
|
2
|
2
|
| Seats won
|
4
|
3
|
| Seat change
|
 2 2
|
 1 1
|
| Popular vote
|
1,307,046
|
821,144
|
| Percentage
|
7.43%
|
4.67%
|
| Swing
|
 3.51pp 3.51pp
|
 1.38pp 1.38pp
|
|
