This article needs additional citations for verification. (January 2017) |
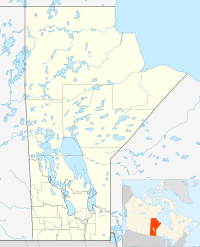
Pine Dock is a small fishing community by Lake Winnipeg in Manitoba, Canada. It had a population that was largest in the 1970s. Since this time its population has decreased. There is a small public beach and community town hall that continues to operate. During the 1970s to 1980s there was a small general store and a gas station, and an elementary school run by the Frontier School Division, however these are no longer operating. There is still a government dock and fishing station that continues to be used by local fishing industry. The next closest community is located on Matheson Island, Manitoba, that is 15 miles north of Pine Dock on Provincial Road 234, and accessed by a cable Ferry. South of Pine Dock are several recreational cottage developments including Beaver Creek Provincial Park (Manitoba), Mill Creek and Little Deer.
Demographics
editIn the 2021 Census of Population conducted by Statistics Canada, Pine Dock had a population of 38 living in 18 of its 42 total private dwellings, a change of -19.1% from its 2016 population of 47. With a land area of 9.65 km2 (3.73 sq mi), it had a population density of 3.9/km2 (10.2/sq mi) in 2021.[1]
Climate
edit| Climate data for Pine Dock | |||||||||||||
|---|---|---|---|---|---|---|---|---|---|---|---|---|---|
| Month | Jan | Feb | Mar | Apr | May | Jun | Jul | Aug | Sep | Oct | Nov | Dec | Year |
| Record high °C (°F) | 7 (45) |
9 (48) |
12 (54) |
28 (82) |
33 (91) |
33 (91) |
34.4 (93.9) |
34 (93) |
32 (90) |
26 (79) |
19.4 (66.9) |
7.2 (45.0) |
34.4 (93.9) |
| Mean daily maximum °C (°F) | −14.3 (6.3) |
−10.1 (13.8) |
−2.1 (28.2) |
7.3 (45.1) |
15.7 (60.3) |
21.3 (70.3) |
24.2 (75.6) |
22.9 (73.2) |
16 (61) |
8.4 (47.1) |
−2.5 (27.5) |
−11.1 (12.0) |
6.3 (43.3) |
| Daily mean °C (°F) | −19.7 (−3.5) |
−16.2 (2.8) |
−8.1 (17.4) |
1.4 (34.5) |
9.5 (49.1) |
15.9 (60.6) |
18.9 (66.0) |
17.7 (63.9) |
11.3 (52.3) |
4.5 (40.1) |
−6.2 (20.8) |
−16 (3) |
1.1 (34.0) |
| Mean daily minimum °C (°F) | −25.1 (−13.2) |
−22.2 (−8.0) |
−14.2 (6.4) |
−4.6 (23.7) |
3.3 (37.9) |
10.3 (50.5) |
13.5 (56.3) |
12.5 (54.5) |
6.5 (43.7) |
0.5 (32.9) |
−9.9 (14.2) |
−20.8 (−5.4) |
−4.2 (24.4) |
| Record low °C (°F) | −42.2 (−44.0) |
−48.9 (−56.0) |
−38 (−36) |
−29 (−20) |
−11.1 (12.0) |
−3.3 (26.1) |
−1.1 (30.0) |
1 (34) |
−7 (19) |
−18 (0) |
−35 (−31) |
−43.3 (−45.9) |
−48.9 (−56.0) |
| Average precipitation mm (inches) | 27.3 (1.07) |
22.2 (0.87) |
29.6 (1.17) |
26.5 (1.04) |
41.8 (1.65) |
83.7 (3.30) |
74.8 (2.94) |
92.3 (3.63) |
77.4 (3.05) |
54.9 (2.16) |
47.6 (1.87) |
33.7 (1.33) |
611.9 (24.09) |
| Source: Environment Canada[2] | |||||||||||||
References
edit- ^ "Population and dwelling counts: Canada and designated places". Statistics Canada. February 9, 2022. Retrieved September 3, 2022.
- ^ "Canadian Climate Normals 1971–2000". Environment Canada. Retrieved August 26, 2012.
External links
edit51°38′30″N 96°48′20″W / 51.64167°N 96.80556°W
