This article has multiple issues. Please help improve it or discuss these issues on the talk page. (Learn how and when to remove these messages)
|
Main Brook is a town in the Canadian province of Newfoundland and Labrador. The town had a population of 246 in the Canada 2021 Census.
Main Brook | |
|---|---|
Town | |
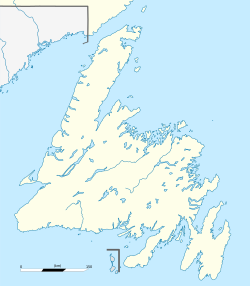
Location of Main Brook in Newfoundland | |
| Coordinates: 51°09′55″N 55°59′15″W / 51.16528°N 55.98750°W[1] | |
| Country | Canada |
| Province | Newfoundland and Labrador |
| Population (2021) | |
• Total | 246 |
| Time zone | UTC−03:30 (NST) |
| • Summer (DST) | UTC−02:30 (NDT) |
| Area code | 709 |
| Highways | |
Demographics
editIn the 2021 Census of Population conducted by Statistics Canada, Main Brook had a population of 246 living in 118 of its 180 total private dwellings, a change of 1.2% from its 2016 population of 243. With a land area of 28 km2 (11 sq mi), it had a population density of 8.8/km2 (22.8/sq mi) in 2021.[2]
Climate
edit| Climate data for Main Brook Climate ID:: 840KE88; coordinates 51°11′N 56°01′W / 51.183°N 56.017°W; elevation: 14 m (46 ft); 1981-2010 normals | |||||||||||||
|---|---|---|---|---|---|---|---|---|---|---|---|---|---|
| Month | Jan | Feb | Mar | Apr | May | Jun | Jul | Aug | Sep | Oct | Nov | Dec | Year |
| Record high °C (°F) | 11.0 (51.8) |
9.0 (48.2) |
11.0 (51.8) |
15.0 (59.0) |
25.0 (77.0) |
30.0 (86.0) |
31.0 (87.8) |
30.5 (86.9) |
28.0 (82.4) |
23.5 (74.3) |
18.5 (65.3) |
13.5 (56.3) |
31.0 (87.8) |
| Mean daily maximum °C (°F) | −6.3 (20.7) |
−6.0 (21.2) |
−1.7 (28.9) |
3.6 (38.5) |
9.6 (49.3) |
15.0 (59.0) |
19.2 (66.6) |
19.5 (67.1) |
15.2 (59.4) |
8.5 (47.3) |
2.5 (36.5) |
−2.6 (27.3) |
6.4 (43.5) |
| Daily mean °C (°F) | −11.0 (12.2) |
−11.0 (12.2) |
−6.4 (20.5) |
−0.3 (31.5) |
5.1 (41.2) |
10.0 (50.0) |
14.2 (57.6) |
14.7 (58.5) |
10.7 (51.3) |
5.0 (41.0) |
−0.7 (30.7) |
−6.4 (20.5) |
2.0 (35.6) |
| Mean daily minimum °C (°F) | −15.7 (3.7) |
−16.0 (3.2) |
−11.1 (12.0) |
−4.2 (24.4) |
0.5 (32.9) |
4.9 (40.8) |
9.1 (48.4) |
9.9 (49.8) |
6.2 (43.2) |
1.5 (34.7) |
−3.8 (25.2) |
−10.1 (13.8) |
−2.4 (27.7) |
| Record low °C (°F) | −34.0 (−29.2) |
−35.0 (−31.0) |
−34.0 (−29.2) |
−22.0 (−7.6) |
−10.0 (14.0) |
−2.0 (28.4) |
0.0 (32.0) |
1.0 (33.8) |
−3.0 (26.6) |
−9.0 (15.8) |
−22.5 (−8.5) |
−31.0 (−23.8) |
−35.0 (−31.0) |
| Average precipitation mm (inches) | 129.8 (5.11) |
137.8 (5.43) |
88.4 (3.48) |
69.9 (2.75) |
73.6 (2.90) |
99.0 (3.90) |
108.8 (4.28) |
100.1 (3.94) |
89.6 (3.53) |
105.8 (4.17) |
92.1 (3.63) |
129.0 (5.08) |
1,223.9 (48.2) |
| Average rainfall mm (inches) | 9.5 (0.37) |
12.7 (0.50) |
15.2 (0.60) |
33.6 (1.32) |
60.8 (2.39) |
97.9 (3.85) |
108.8 (4.28) |
100.1 (3.94) |
89.6 (3.53) |
102.9 (4.05) |
52.5 (2.07) |
25.3 (1.00) |
708.8 (27.91) |
| Average snowfall cm (inches) | 120.2 (47.3) |
125.1 (49.3) |
73.2 (28.8) |
36.3 (14.3) |
12.8 (5.0) |
1.1 (0.4) |
0.0 (0.0) |
0.0 (0.0) |
0.0 (0.0) |
2.9 (1.1) |
39.7 (15.6) |
103.8 (40.9) |
515.0 (202.8) |
| Average precipitation days (≥ 0.2 mm) | 12.3 | 10.9 | 9.5 | 8.5 | 10.7 | 11.9 | 13.4 | 11.9 | 11.7 | 14.7 | 12.1 | 13.0 | 140.5 |
| Average rainy days (≥ 0.2 mm) | 1.5 | 1.3 | 2.1 | 4.6 | 9.5 | 11.9 | 13.4 | 11.9 | 11.7 | 14.4 | 7.7 | 3.3 | 93.2 |
| Average snowy days (≥ 0.2 cm) | 11.1 | 9.9 | 7.6 | 4.5 | 1.2 | 0.14 | 0.0 | 0.0 | 0.0 | 0.67 | 5.1 | 10.4 | 50.7 |
| Source: Environment and Climate Change Canada[3] | |||||||||||||
References
edit- ^ "Main Brook". Geographical Names Data Base. Natural Resources Canada.
- ^ "Population and dwelling counts: Canada, provinces and territories, census divisions and census subdivisions (municipalities), Newfoundland and Labrador". Statistics Canada. February 9, 2022. Retrieved March 15, 2022.
- ^ "Main Brook". Canadian Climate Normals 1981–2010. 25 November 2021. Retrieved 16 February 2022.
See also
edit
