Loreto, officially the Municipality of Loreto (Cebuano: Lungsod sa Loreto; Tagalog: Bayan ng Loreto), is a 1st class municipality in the province of Agusan del Sur, Philippines. According to the 2020 census, it has a population of 43,880 people.[3] Loreto is the largest Municipality in terms of land area in Mindanao.
Loreto | |
|---|---|
| Municipality of Loreto | |
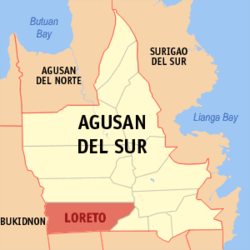
 Map of Agusan del Sur with Loreto highlighted | |
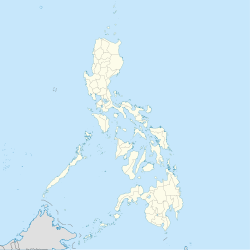
Location within the Philippines | |
| Coordinates: 8°11′N 125°51′E / 8.19°N 125.85°E | |
| Country | Philippines |
| Region | Caraga |
| Province | Agusan del Sur |
| District | 2nd district |
| Founded | March 30, 1965 |
| Barangays | 17 (see Barangays) |
| Government | |
| • Type | Sangguniang Bayan |
| • Mayor | Lorife M. Otaza |
| • Vice Mayor | Randolph B. Plaza |
| • Representative | Adolph Edward G. Plaza |
| • Electorate | 26,756 voters (2022) |
| Area | |
• Total | 1,462.74 km2 (564.77 sq mi) |
| Elevation | 335 m (1,099 ft) |
| Highest elevation | 1,658 m (5,440 ft) |
| Lowest elevation | 16 m (52 ft) |
| Population (2020 census)[3] | |
• Total | 43,880 |
| • Density | 30/km2 (78/sq mi) |
| • Households | 10,136 |
| Economy | |
| • Income class | 1st municipal income class |
| • Poverty incidence | 45.32 |
| • Revenue | ₱ 392.9 million (2020) |
| • Assets | ₱ 934.5 million (2020) |
| • Expenditure | ₱ 353.9 million (2020) |
| • Liabilities | ₱ 351 million (2020) |
| Service provider | |
| • Electricity | Agusan del Sur Electric Cooperative (ASELCO) |
| Time zone | UTC+8 (PST) |
| ZIP code | 8507 |
| PSGC | |
| IDD : area code | +63 (0)85 |
| Native languages | Agusan Butuanon Cebuano Higaonon Tagalog |
History
editIt was in the year 1600 long before Fr. Urios came to Agusan in 1880 when the Spaniards first came to the upper reaches of Agusan and discovered the Manobos. In convincing the Manobos to organize themselves and live in a settlement/community, the settlement was given the name of "Loreto" in remembrance of Fr. Urios town in Spain on March 30, 1965.[citation needed]
Rain of fish
editOn a rainy morning on January 13, 2012, Loreto became nationally notable when it became the site of a rain of fish. Seventy-two small fish were recovered and placed in an aquarium. They were about 3 in (7.6 cm) long and had small spots, but the species remains unknown. The Bureau of Fisheries and Aquatic Resources attributes the phenomenon to a waterspout.[5][6][7]
Geography
editAccording to the Philippine Statistics Authority, the municipality has a land area of 1,462.74 square kilometres (564.77 sq mi) [8] constituting 14.64% of the 9,989.52-square-kilometre- (3,856.98 sq mi) total area of Agusan del Sur.
Loreto is a river town situated south-west of Agusan del Sur. It is bounded on the north by La Paz, north-east by Bunawan, and southeast by Veruela. The provinces of Bukidnon and Davao del Norte bound its Western and Southern portions.
Loreto is a strategically situated as a junction point to various destination within Agusan del Sur and nearby provinces. The accessibility of Loreto to Provincial Center, Patin-ay in Prosperidad has three main routes: the Loreto-Santa Josefa-Trento route of 118.36 kilometres (73.55 mi), the Loreto-La Paz Talacogon route of 85.53 kilometres (53.15 mi), and the Loreto-Bunawan route of 87.52 kilometres (54.38 mi) with two hours of Pump boat cruising the Agusan River.
Climate
edit| Climate data for Loreto, Agusan del Sur | |||||||||||||
|---|---|---|---|---|---|---|---|---|---|---|---|---|---|
| Month | Jan | Feb | Mar | Apr | May | Jun | Jul | Aug | Sep | Oct | Nov | Dec | Year |
| Mean daily maximum °C (°F) | 27 (81) |
27 (81) |
28 (82) |
30 (86) |
30 (86) |
30 (86) |
30 (86) |
30 (86) |
30 (86) |
30 (86) |
29 (84) |
28 (82) |
29 (84) |
| Mean daily minimum °C (°F) | 23 (73) |
23 (73) |
22 (72) |
23 (73) |
24 (75) |
24 (75) |
24 (75) |
24 (75) |
24 (75) |
24 (75) |
23 (73) |
23 (73) |
23 (74) |
| Average precipitation mm (inches) | 105 (4.1) |
72 (2.8) |
55 (2.2) |
40 (1.6) |
69 (2.7) |
94 (3.7) |
100 (3.9) |
103 (4.1) |
99 (3.9) |
106 (4.2) |
85 (3.3) |
63 (2.5) |
991 (39) |
| Average rainy days | 17.6 | 16.0 | 14.9 | 14.0 | 20.9 | 24.3 | 25.3 | 25.5 | 24.5 | 24.7 | 19.7 | 16.7 | 244.1 |
| Source: Meteoblue[9] | |||||||||||||
Barangays
editLoreto is politically subdivided into 17 barangays.[10] Each barangay consists of puroks while some have sitios.
| PSGC | Barangay | Population | ±% p.a. | |||
|---|---|---|---|---|---|---|
| 2020[3] | 2010[11] | |||||
| 160305001 | Binucayan | 6.3% | 2,781 | 3,605 | −2.56% | |
| 160305002 | Johnson | 3.3% | 1,433 | 1,547 | −0.76% | |
| 160305013 | Kasapa | 4.0% | 1,738 | 3,122 | −5.69% | |
| 160305014 | Katipunan | 1.2% | 525 | 677 | −2.51% | |
| 160305015 | Kauswagan | 5.6% | 2,445 | 2,182 | 1.14% | |
| 160305003 | Magaud | 7.6% | 3,314 | 2,303 | 3.71% | |
| 160305004 | Nueva Gracia | 5.2% | 2,270 | 1,928 | 1.65% | |
| 160305005 | Poblacion | 14.5% | 6,384 | 6,456 | −0.11% | |
| 160305017 | Sabud | 10.0% | 4,367 | 779 | 18.81% | |
| 160305006 | San Isidro | 3.6% | 1,601 | 1,532 | 0.44% | |
| 160305007 | San Mariano | 5.5% | 2,411 | 2,709 | −1.16% | |
| 160305008 | San Vicente | 4.9% | 2,163 | 2,227 | −0.29% | |
| 160305009 | Santa Teresa | 5.3% | 2,325 | 2,324 | 0.00% | |
| 160305016 | Santo Niño | 2.5% | 1,088 | 1,221 | −1.15% | |
| 160305010 | Santo Tomas | 8.8% | 3,859 | 3,674 | 0.49% | |
| 160305011 | Violanta | 3.3% | 1,439 | 1,174 | 2.06% | |
| 160305012 | Waloe | 5.4% | 2,358 | 2,014 | 1.59% | |
| Total | 43,880 | 39,474 | 1.06% | |||
Demographics
edit| Year | Pop. | ±% p.a. |
|---|---|---|
| 1918 | 2,447 | — |
| 1939 | 4,395 | +2.83% |
| 1948 | 4,125 | −0.70% |
| 1960 | 6,248 | +3.52% |
| 1970 | 13,057 | +7.64% |
| 1975 | 16,264 | +4.50% |
| 1980 | 18,781 | +2.92% |
| 1990 | 21,133 | +1.19% |
| 1995 | 24,022 | +2.43% |
| 2000 | 31,365 | +5.88% |
| 2007 | 34,549 | +1.34% |
| 2010 | 39,474 | +4.97% |
| 2015 | 42,501 | +1.42% |
| 2020 | 43,880 | +0.63% |
| Source: Philippine Statistics Authority[12][11][13][14] | ||
According to the 2020 census, Loreto had a population of 43,880.[3] The population density was 30 inhabitants per square kilometre (78/sq mi).
Economy
editPoverty incidence of Loreto
10
20
30
40
50
60
70
80
2006
70.30 2009
56.88 2012
48.58 2015
49.01 2018
44.37 2021
45.32 Source: Philippine Statistics Authority[15][16][17][18][19][20][21][22] |
References
edit- ^ Municipality of Loreto | (DILG)
- ^ "2015 Census of Population, Report No. 3 – Population, Land Area, and Population Density" (PDF). Philippine Statistics Authority. Quezon City, Philippines. August 2016. ISSN 0117-1453. Archived (PDF) from the original on May 25, 2021. Retrieved July 16, 2021.
- ^ a b c d Census of Population (2020). "Caraga". Total Population by Province, City, Municipality and Barangay. Philippine Statistics Authority. Retrieved 8 July 2021.
- ^ "PSA Releases the 2021 City and Municipal Level Poverty Estimates". Philippine Statistics Authority. 2 April 2024. Retrieved 28 April 2024.
- ^ Jereco O. Paloma (January 15, 2012). "Agusan's 'rain of fish' natural although unusual". SunStar Davao. Archived from the original on August 26, 2014. Retrieved January 16, 2012.
- ^ Lani Nami Buan (January 15, 2012). "'Fish rain' puzzles residents in Agusan Sur's Loreto town". GMA News. Retrieved January 16, 2012.
- ^ Charmane Awitan (January 13, 2012). "Fish rain down on Agusan del Sur town". ABS-CBN News. Retrieved January 16, 2012.
- ^ "Province: Agusan del Sur". PSGC Interactive. Quezon City, Philippines: Philippine Statistics Authority. Retrieved 12 November 2016.
- ^ "Loreto: Average Temperatures and Rainfall". Meteoblue. Retrieved 29 April 2020.
- ^ "Municipal: Loreto, Agusan del Sur". PSGC Interactive. Quezon City, Philippines: Philippine Statistics Authority. Retrieved 8 January 2016.
- ^ a b Census of Population and Housing (2010). "Caraga" (PDF). Total Population by Province, City, Municipality and Barangay. National Statistics Office. Retrieved 29 June 2016.
- ^ Census of Population (2015). "Caraga". Total Population by Province, City, Municipality and Barangay. Philippine Statistics Authority. Retrieved 20 June 2016.
- ^ Censuses of Population (1903–2007). "Caraga". Table 1. Population Enumerated in Various Censuses by Province/Highly Urbanized City: 1903 to 2007. National Statistics Office.
- ^ "Province of Agusan del Sur". Municipality Population Data. Local Water Utilities Administration Research Division. Retrieved 17 December 2016.
- ^ "Poverty incidence (PI):". Philippine Statistics Authority. Retrieved December 28, 2020.
- ^ "Estimation of Local Poverty in the Philippines" (PDF). Philippine Statistics Authority. 29 November 2005.
- ^ "2003 City and Municipal Level Poverty Estimates" (PDF). Philippine Statistics Authority. 23 March 2009.
- ^ "City and Municipal Level Poverty Estimates; 2006 and 2009" (PDF). Philippine Statistics Authority. 3 August 2012.
- ^ "2012 Municipal and City Level Poverty Estimates" (PDF). Philippine Statistics Authority. 31 May 2016.
- ^ "Municipal and City Level Small Area Poverty Estimates; 2009, 2012 and 2015". Philippine Statistics Authority. 10 July 2019.
- ^ "PSA Releases the 2018 Municipal and City Level Poverty Estimates". Philippine Statistics Authority. 15 December 2021. Retrieved 22 January 2022.
- ^ "PSA Releases the 2021 City and Municipal Level Poverty Estimates". Philippine Statistics Authority. 2 April 2024. Retrieved 28 April 2024.


