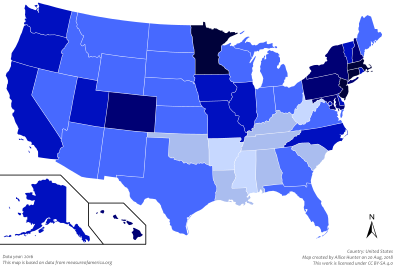
This article presents a sortable table of U.S. states sorted by their American Human Development Index, according to Measure of America. The data were taken from the American Human Development Report.

> 6.0
< 6.0
< 5.5
< 5.0
< 4.5
< 4.0
The territories of the United States are listed separately (they were not included in Measure of America's report); the territories data is from a different source (based on United Nations Development Programme), which uses a different numbering system.[1]
States and federal district
edit| Rank | State/federal district | American HDI | ||
|---|---|---|---|---|
| 2014/2015 values for 2014[2] | Change compared to 2008/2009 values for 2005[2] | 2014/2015 values for 2014[2] | Change compared to 2008/2009 values for 2005[2] | |
| 1 | Massachusetts | 6.18 | 0.19 | |
| 2 | Connecticut | 6.17 | 0.12 | |
| 3 | (1) | New Jersey | 6.12 | 0.02 |
| 4 | (2) | Minnesota | 6.10 | 0.03 |
| 5 | Maryland | 5.94 | 0.05 | |
| 6 | (2) | New Hampshire | 5.73 | 0.06 |
| 7 | (1) | Pennsylvania | 5.72 | 0.03 |
| 8 | (1) | New York | 5.66 | 0.15 |
| 9 | (3) | Colorado | 5.53 | 0.05 |
| 10 | (4) | Hawaii | 5.53 | 0.29 |
| 11 | (2) | Oregon | 5.42 | 0.04 |
| 12 | (1) | California | 5.40 | 0.22 |
| 13 | (3) | Washington | 5.40 | 0.01 |
| 14 | (4) | Rhode Island | 5.38 | 0.34 |
| 15 | (1) | Vermont | 5.31 | 0.12 |
| 16 | (1) | Illinois | 5.31 | 0.11 |
| 17 | (1) | Delaware | 5.22 | |
| 18 | Missouri | 5.19 | 0.06 | |
| 19 | (4) | North Carolina | 5.17 | 0.04 |
| 20 | (1) | District of Columbia | 5.11 | 0.06 |
| 21 | (4) | Alaska | 5.06 | 0.29 |
| 22 | Iowa | 5.03 | ||
| 23 | (7) | Utah | 5.03 | 0.17 |
| 24 | (1) | Kansas | 4.96 | 0.03 |
| 25 | (4) | Maine | 4.93 | 0.09 |
| 26 | (1) | North Dakota | 4.90 | |
| 27 | (1) | Arizona | 4.89 | 0.01 |
| 28 | (2) | Virginia | 4.87 | 0.09 |
| 29 | (9) | Wyoming | 4.83 | 0.30 |
| 30 | (6) | Florida | 4.82 | 0.15 |
| 31 | (8) | South Dakota | 4.79 | 0.26 |
| 32 | (12) | Michigan | 4.76 | 0.37 |
| 33 | (2) | Ohio | 4.71 | 0.09 |
| 34 | (1) | Texas | 4.65 | 0.08 |
| 35 | (1) | Nevada | 4.63 | 0.09 |
| 36 | (4) | Georgia | 4.62 | 0.10 |
| 37 | (1) | Wisconsin | 4.59 | 0.04 |
| 38 | (4) | Nebraska | 4.58 | 0.11 |
| 39 | (6) | Indiana | 4.56 | 0.08 |
| 40 | (2) | Montana | 4.54 | 0.20 |
| 41 | (1) | New Mexico | 4.52 | 0.03 |
| 42 | (1) | Idaho | 4.50 | 0.13 |
| 43 | South Carolina | 4.35 | 0.08 | |
| 44 | (1) | Tennessee | 4.22 | 0.11 |
| 45 | (1) | Oklahoma | 4.14 | 0.13 |
| 46 | (3) | Louisiana | 4.12 | 0.27 |
| 47 | Alabama | 4.04 | 0.07 | |
| 48 | (4) | Kentucky | 4.02 | 0.10 |
| 49 | (1) | West Virginia | 3.95 | 0.11 |
| 50 | (2) | Arkansas | 3.91 | 0.06 |
| 51 | Mississippi | 3.81 | 0.23 | |
Territories
edit| Territory[1] | HDI | Data Year | Status |
|---|---|---|---|
| Guam | 0.901 | 2008 | Very High human development |
| US Virgin Islands | 0.894 | 2008 | Very High human development |
| Puerto Rico | 0.880 | 2024 | Very High human development |
| Northern Mariana Islands | 0.875 | 2008 | Very High human development |
| American Samoa | 0.827 | 2008 | Very High human development |
See also
editReferences
edit- ^ a b http://www.unescap.org/sites/default/files/wp-09-02.pdf Filling Gaps In The Human Development Index: Findings For Asia And The Pacific. David A. Hastings. Retrieved 8 January 2018.
- ^ a b c d "HDI Map". American Human Development Project of the Social Science Research Council. Retrieved December 28, 2016.