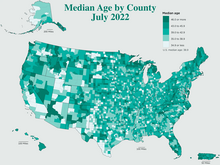
This is a list of U.S. states, the District of Columbia and territories by median age in 2020.[note 1] The median age is the index that divides the entire population into two numerically equal age groups, one younger than that age and the other older than that age. It is the only index associated with the age distribution of a population.

Median Age by County 2022
46 or more
43 to 45.9
39 to 42.9
35 to 39.9
34.9 or less
| Rank | State, federal district, or territory |
Median age in years (Total Population)[1][2][note 2] |
|---|---|---|
| 1 | 45.9 | |
| 2 | 45.0 | |
| 3 | 43.6 | |
| 4 | 43.1 | |
| 5 | 43.0 | |
| 5 | 43.0 | |
| 7 | 42.7 | |
| 8 | 41.4 | |
| 9 | 41.2 | |
| 10 | 40.9 | |
| 11 | 40.3 | |
| 12 | 40.2 | |
| 12 | 40.2 | |
| 14 | 40.1 | |
| 14 | 40.1 | |
| 16 | 40.0 | |
| 16 | 40.0 | |
| 18 | 39.9 | |
| 19 | 39.7 | |
| 20 | 39.6 | |
| 21 | 39.5 | |
| 22 | 39.4 | |
| 23 | 39.2 | |
| 23 | 39.2 | |
| 23 | 39.2 | |
| 26 | 39.1 | |
| 26 | 39.1 | |
| 28 | 38.8 | |
| 29 | 38.7 | |
| 29 | 38.7 | |
| 31 | 38.6 | |
| 31 | 38.6 | |
| 31 | 38.6 | |
| 34 | 38.5 | |
| 34 | 38.5 | |
| 34 | 38.5 | |
| 37 | 38.3 | |
| — | 38.2 | |
| 38 | 38.0 | |
| 39 | 37.9 | |
| 40 | 37.8 | |
| 41 | 37.6 | |
| 42 | 37.3 | |
| 42 | 37.3 | |
| 42 | 37.3 | |
| 42 | 37.3 | |
| 46 | 37.2 | |
| 47 | 37.1 | |
| 48 | 36.9 | |
| 49 | 35.4 | |
| 50 | 35.3 | |
| 51 | 35.2 | |
| 52 | 34.4 | |
| 53 | 34.4 | |
| 54 | 33.7 | |
| 55 | 31.5 | |
| 56 | 27.7 |
See also
editNotes
editReferences
edit- ^ "Median Age in 2019". www.statsamerica.org. Retrieved 2020-02-26.
- ^ a b c d e f "The World Factbook — Central Intelligence Agency". www.cia.gov. Retrieved 2019-06-09.