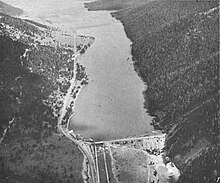
Hebgen Dam is a concrete-core earthen embankment dam in the western United States, located on the Madison River in southwestern Montana. The dam is 85 feet (26 m) tall and 721 feet (220 m) in length; its purpose is to store and regulate water for other downstream reservoirs and hydroelectric power plants.[2] Montana Power Company originally built the dam, PPL Corporation purchased it in 1997 and sold it to NorthWestern Corporation in 2014.
| Hebgen Dam | |
|---|---|
 The damaged Hebgen Dam in 1959 | |
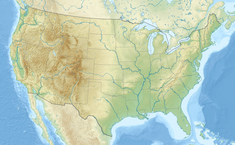
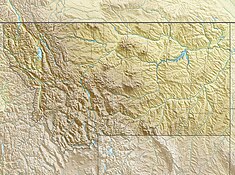
Location in the United States Location in Montana | |
| Official name | Hebgen Dam |
| Location | Gallatin County, Montana |
| Coordinates | 44°51′49″N 111°20′08″W / 44.86361°N 111.33556°W |
| Opening date | 1914 |
| Owner(s) | NorthWestern Corporation |
| Dam and spillways | |
| Type of dam | Concrete-core, earthen embankment |
| Impounds | Madison River |
| Height | 85 feet (26 m) |
| Length | 721 feet (220 m) |
| Spillway type | Chute, gate-controlled |
| Reservoir | |
| Creates | Hebgen Lake |
| Total capacity | 325,000 acre⋅ft (0.401 km3)[1] |
| Catchment area | 905 square miles (2,340 km2) |
| Surface area | 21 square miles (54 km2) |
History
editHebgen Dam was built across the Madison River in 1914 by Montana Power Company to create Hebgen Lake.
During the 7.5 magnitude 1959 Hebgen Lake earthquake in mid-August, the dam was damaged, primarily because of such intense ground movement that water surged over the dam crest four different times, but it was fixed several weeks later.[3] The epicenter of the quake was determined to be 20 miles (32 km) beneath the bottom of Hebgen Lake. Seismologists reported it to be the fourth largest quake recorded in the United States up to that time.[4]
On August 30, 2008, two of the dam's four hydraulic gates failed, releasing 3,400 cubic feet (96 m3) per second of water into the Madison River. The normal discharge of the dam is 900 cubic feet (25 m3) per second and the gate failure caused a 1-foot rise in the river.[5]
On November 30th, 2021, the hydraulic gates failed again causing downstream flows to rapidly drop.[6] Nearby locals quickly organized an effort to rescue stranded fish trapped in pools in the side channels. [7] An ongoing lawsuit against Northwestern Energy (as of 2024) claims that NWE failed in its requrirement to keep streamflows above 150 CFS.[8]
Climate
edit| Climate data for Hebgen Dam, Montana, 1991–2020 normals, 1904–2020 extremes: 6489ft (1978m) | |||||||||||||
|---|---|---|---|---|---|---|---|---|---|---|---|---|---|
| Month | Jan | Feb | Mar | Apr | May | Jun | Jul | Aug | Sep | Oct | Nov | Dec | Year |
| Record high °F (°C) | 45 (7) |
49 (9) |
60 (16) |
75 (24) |
88 (31) |
96 (36) |
98 (37) |
94 (34) |
93 (34) |
82 (28) |
62 (17) |
51 (11) |
98 (37) |
| Mean maximum °F (°C) | 35.2 (1.8) |
40.5 (4.7) |
51.4 (10.8) |
62.9 (17.2) |
74.3 (23.5) |
81.6 (27.6) |
88.0 (31.1) |
87.3 (30.7) |
81.8 (27.7) |
68.2 (20.1) |
49.1 (9.5) |
36.7 (2.6) |
88.5 (31.4) |
| Mean daily maximum °F (°C) | 22.9 (−5.1) |
27.9 (−2.3) |
38.4 (3.6) |
46.8 (8.2) |
58.4 (14.7) |
68.4 (20.2) |
78.7 (25.9) |
78.0 (25.6) |
67.7 (19.8) |
50.7 (10.4) |
34.0 (1.1) |
22.7 (−5.2) |
49.6 (9.7) |
| Daily mean °F (°C) | 13.2 (−10.4) |
16.5 (−8.6) |
26.1 (−3.3) |
35.0 (1.7) |
45.4 (7.4) |
53.7 (12.1) |
61.7 (16.5) |
60.7 (15.9) |
52.4 (11.3) |
39.4 (4.1) |
26.0 (−3.3) |
14.3 (−9.8) |
37.0 (2.8) |
| Mean daily minimum °F (°C) | 3.5 (−15.8) |
5.1 (−14.9) |
13.8 (−10.1) |
23.3 (−4.8) |
32.3 (0.2) |
38.9 (3.8) |
44.6 (7.0) |
43.4 (6.3) |
37.2 (2.9) |
28.2 (−2.1) |
17.9 (−7.8) |
5.8 (−14.6) |
24.5 (−4.2) |
| Mean minimum °F (°C) | −23.9 (−31.1) |
−24.1 (−31.2) |
−10.8 (−23.8) |
6.8 (−14.0) |
20.6 (−6.3) |
29.5 (−1.4) |
36.6 (2.6) |
35.2 (1.8) |
26.2 (−3.2) |
13.1 (−10.5) |
−1.4 (−18.6) |
−18.5 (−28.1) |
−29.4 (−34.1) |
| Record low °F (°C) | −47 (−44) |
−60 (−51) |
−38 (−39) |
−20 (−29) |
8 (−13) |
19 (−7) |
25 (−4) |
12 (−11) |
6 (−14) |
−9 (−23) |
−35 (−37) |
−43 (−42) |
−60 (−51) |
| Average precipitation inches (mm) | 3.06 (78) |
2.76 (70) |
2.17 (55) |
2.28 (58) |
3.14 (80) |
2.99 (76) |
1.62 (41) |
1.38 (35) |
1.59 (40) |
2.08 (53) |
2.49 (63) |
3.07 (78) |
28.63 (727) |
| Average snowfall inches (cm) | 43.80 (111.3) |
33.70 (85.6) |
20.60 (52.3) |
7.70 (19.6) |
1.20 (3.0) |
0.00 (0.00) |
0.00 (0.00) |
0.00 (0.00) |
0.00 (0.00) |
4.10 (10.4) |
20.90 (53.1) |
45.20 (114.8) |
177.2 (450.1) |
| Source 1: NOAA[9] | |||||||||||||
| Source 2: XMACIS2 (records & monthly max/mins)[10] | |||||||||||||
| Climate data for Hebgen Dam, Montana, 1904–2016 normals, extremes 1893–present | |||||||||||||
|---|---|---|---|---|---|---|---|---|---|---|---|---|---|
| Month | Jan | Feb | Mar | Apr | May | Jun | Jul | Aug | Sep | Oct | Nov | Dec | Year |
| Record high °F (°C) | 45 (7) |
49 (9) |
60 (16) |
75 (24) |
88 (31) |
96 (36) |
98 (37) |
94 (34) |
93 (34) |
82 (28) |
62 (17) |
51 (11) |
98 (37) |
| Mean maximum °F (°C) | 37 (3) |
41 (5) |
51 (11) |
62 (17) |
75 (24) |
83 (28) |
88 (31) |
87 (31) |
82 (28) |
69 (21) |
49 (9) |
38 (3) |
86.6 (30.3) |
| Mean daily maximum °F (°C) | 22.4 (−5.3) |
28.4 (−2.0) |
37.5 (3.1) |
47.2 (8.4) |
58.5 (14.7) |
69.2 (20.7) |
77.4 (25.2) |
76.6 (24.8) |
66.6 (19.2) |
52.0 (11.1) |
32.6 (0.3) |
22.2 (−5.4) |
49.2 (9.6) |
| Daily mean °F (°C) | 12.1 (−11.1) |
16.1 (−8.8) |
22.7 (−5.2) |
34.4 (1.3) |
44.9 (7.2) |
53.5 (11.9) |
60.2 (15.7) |
59.8 (15.4) |
51.0 (10.6) |
40.1 (4.5) |
24.7 (−4.1) |
13.1 (−10.5) |
36.1 (2.2) |
| Mean daily minimum °F (°C) | 2.7 (−16.3) |
5.1 (−14.9) |
13.1 (−10.5) |
22.9 (−5.1) |
31.9 (−0.1) |
38.7 (3.7) |
43.5 (6.4) |
42.9 (6.1) |
35.5 (1.9) |
28.0 (−2.2) |
16.6 (−8.6) |
4.6 (−15.2) |
23.8 (−4.6) |
| Mean minimum °F (°C) | −27 (−33) |
−26 (−32) |
−16 (−27) |
4 (−16) |
20 (−7) |
29 (−2) |
35 (2) |
33 (1) |
24 (−4) |
13 (−11) |
−4 (−20) |
−21 (−29) |
−32 (−36) |
| Record low °F (°C) | −47 (−44) |
−60 (−51) |
−38 (−39) |
−20 (−29) |
8 (−13) |
19 (−7) |
25 (−4) |
12 (−11) |
6 (−14) |
−9 (−23) |
−35 (−37) |
−43 (−42) |
−60 (−51) |
| Average precipitation inches (mm) | 2.88 (73) |
2.28 (58) |
2.29 (58) |
1.81 (46) |
2.61 (66) |
2.79 (71) |
1.74 (44) |
1.58 (40) |
1.66 (42) |
1.83 (46) |
2.33 (59) |
2.72 (69) |
26.52 (672) |
| Average snowfall inches (cm) | 43.7 (111) |
33.2 (84) |
26.5 (67) |
10.3 (26) |
2.7 (6.9) |
0.3 (0.76) |
0.0 (0.0) |
0.0 (0.0) |
0.8 (2.0) |
5.3 (13) |
24.5 (62) |
41.3 (105) |
188.6 (477.66) |
| Source: WRCC[11] | |||||||||||||
See also
editReferences
edit- ^ "HEBGEN LAKE IS 65 MILES AROUND". Montana Standard. 19 August 1959. Archived from the original on 8 March 2012. Retrieved 11 July 2010.
- ^ "Hebgen Lake". PPL Montana. Retrieved 11 July 2010.
- ^ "Hebgen Lake". Montana Official Travel Site. Retrieved 11 July 2010.[permanent dead link]
- ^ Tuholske, Lily. "Yellowstone Earthquake at the Madison River." Distinctly Montana. September 9, 1998. Accessed March 18, 2018.
- ^ "Dam Failures, Dam Incidents (Near Failures)" (PDF). Association of State Dam Safety Officials. Archived from the original (PDF) on 5 July 2010. Retrieved 11 July 2010.
- ^ https://waterdata.usgs.gov/monitoring-location/06038500
- ^ https://www.fieldandstream.com/conservation/madison-river-dry-dam-malfunction/
- ^ https://montanafreepress.org/2021/12/13/northwestern-energy-dam-fire-liability/
- ^ "Hebgen Dam, Montana 1991-2020 Monthly Normals". Retrieved November 21, 2023.
- ^ "xmACIS". National Oceanic and Atmospheric Administration. Retrieved November 21, 2023.
- ^ "Hebgen Dam Monthly Climate Summary". Western Regional Climate Center. Retrieved August 17, 2022.
External links
edit"Yellowstone earthquake at the Madison River." Tuholske, Lily. "Yellowstone Earthquake at the Madison River." Distinctly Montana. September 9, 1998. Accessed March 18, 2018.

