The 2016 Michigan Democratic presidential primary was held on March 8 in the U.S. state of Michigan as one of the Democratic Party's primaries ahead of the 2016 presidential election.
| |||||||||||||||||||
| |||||||||||||||||||
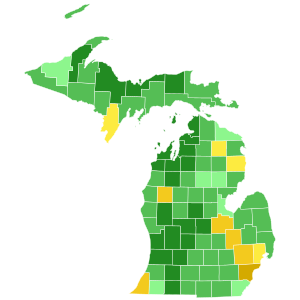
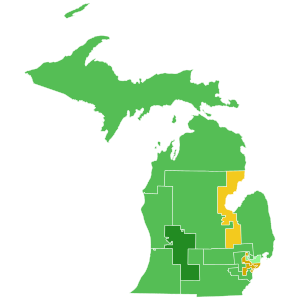
Sanders: 40–50% 50–60% 60–70% Clinton: 40–50% 50–60% 60–70% | |||||||||||||||||||
On the same day, the Democratic Party held a second primary in Mississippi, while the Republican Party held primaries in four states, including their own Michigan primary. Bernie Sanders' narrow win was a massive upset, with polling before the primary showing him trailing Hillary Clinton by an average of 21.4 points.[1]
Clinton lost Michigan by a narrow margin of 0.23% in the general election, against Republican nominee Donald Trump.
Forums and debates
editMarch 2016 debate in Flint
editOn March 6, 2016 the Democratic Party held a seventh presidential debate at The Whiting at the Flint Cultural Center. Flint, Michigan was chosen as the center of the ongoing Flint water crisis.[2] The debate was hosted by Anderson Cooper and aired on CNN. Participants were Hillary Clinton and Bernie Sanders. At the end of the debate, Cooper announced a labor union fund had committed $25 million in low-interest loans towards repairing the water system.
March 2016 forum in Detroit
editThe next day, on March 7, 2016, a Town Hall event, was held as the eighth democratic forum. It started at 6:00 p.m. E.S.T., at the Gem Theatre in Detroit, Michigan, and was aired by the Fox News Channel.[3] The forum was moderated by Bret Baier.
Opinion polling
edit| Poll source | Date | 1st | 2nd | 3rd | Other |
|---|---|---|---|---|---|
| Official Primary results[4] | March 8, 2016 | Bernie Sanders 49.7% |
Hillary Clinton 48.3% |
Others / Uncommitted 2.1% | |
| FOX 2 Detroit/Mitchell[5]
Margin of error: ± 4.5%
|
March 7, 2016 | Hillary Clinton 61% |
Bernie Sanders 34% |
Others / Undecided 5% | |
| FOX 2 Detroit/Mitchell[6]
Margin of error: ± 4.5%
|
March 6, 2016 | Hillary Clinton 66% |
Bernie Sanders 29% |
Others / Undecided 5% | |
| Monmouth[7]
Margin of error: ± 5.6%
|
March 3–6, 2016 | Hillary Clinton 55% |
Bernie Sanders 42% |
Others / Undecided 4% | |
| ARG[8]
Margin of error: ± 5.0%
|
March 4–5, 2016 | Hillary Clinton 60% |
Bernie Sanders 36% |
Others / Undecided 4% | |
| CBS News/YouGov[8]
Margin of error: ± 7.7%
|
March 2–4, 2016 | Hillary Clinton 55% |
Bernie Sanders 44% |
Others / Undecided 1% | |
| Mitchell/FOX 2[9]
Margin of error: ± 4.0%
|
March 2–3, 2016 | Hillary Clinton 55% |
Bernie Sanders 37% |
Others / Undecided 8% | |
| NBC News/Wall St. Jrnl[10]
Margin of error: ± 4.2%
|
March 1–3, 2016 | Hillary Clinton 57% |
Bernie Sanders 40% |
Others / Undecided 3% | |
| MSU[11]
Margin of error: ± 6.1%
|
January 25-March 3, 2016 | Hillary Clinton 52% |
Bernie Sanders 47% |
Others / Undecided 1% | |
| FOX 2 Detroit/Mitchell[12]
Margin of error: ± 4.7%
|
March 1, 2016 | Hillary Clinton 61% |
Bernie Sanders 33% |
Others / Undecided 6% | |
| MRG[13]
Margin of error: ± 4.0%
|
February 22–27, 2016 | Hillary Clinton 56% |
Bernie Sanders 36% |
Others / Undecided 8% | |
| FOX 2 Detroit/Mitchell[14]
Margin of error: ± 5.3%
|
February 23, 2016 | Hillary Clinton 65% |
Bernie Sanders 31% |
Others / Undecided 4% | |
| ARG[15]
Margin of error: ± 5%
|
February 19–20, 2016 | Hillary Clinton 53% |
Bernie Sanders 40% |
Others / Undecided 7% | |
| Fox 2 Detroit/Mitchell[16]
Margin of error: ± 4.69%
|
February 15, 2016 | Hillary Clinton 60% |
Bernie Sanders 27% |
Others / Undecided 13% | |
| Public Policy Polling[17]
Margin of error: ± 4.4
|
February 14–16, 2016 | Hillary Clinton 50% |
Bernie Sanders 40% |
||
| Fox 2 Detroit/Mitchell[18]
Margin of error: ± 5.5%
|
February 4, 2016 | Hillary Clinton 57% |
Bernie Sanders 28% |
Others / Undecided 15% | |
| IMP/Target Insyght [18]
Margin of error: ± 5.0%
|
February 2–4, 2016 | Hillary Clinton 62% |
Bernie Sanders 30% |
Others / Undecided 8% | |
| Marketing Resource Group[19]
Margin of error: ± 4%
|
September 9–14, 2015 | Hillary Clinton 41% |
Bernie Sanders 22% |
Joe Biden 22% | Martin O'Malley 1%, Undecided 12% |
| Public Policy Polling[20]
Margin of error: ± 4.7%
|
June 25–28, 2015 | Hillary Clinton 57% |
Bernie Sanders 25% |
Lincoln Chafee 5% | Jim Webb 2%, Martin O'Malley 1%, Not sure 10% |
| Suffolk[21]
Margin of error: ± ?
|
September 6–10, 2014 | Hillary Clinton 61% |
Joe Biden 17% |
Elizabeth Warren 7% |
Andrew Cuomo 4%, Martin O'Malley 1%, Undecided 9%, Refused 1% |
Results
edit| Michigan Democratic primary, March 8, 2016 | |||||
|---|---|---|---|---|---|
| Candidate | Popular vote | Estimated delegates | |||
| Count | Percentage | Pledged | Unpledged | Total | |
| Bernie Sanders | 598,943 | 49.68% | 67 | 0 | 67 |
| Hillary Clinton | 581,775 | 48.26% | 63 | 10 | 73 |
| Uncommitted | 21,601 | 1.79% | 0 | 7 | 7 |
| Martin O'Malley (withdrawn) | 2,363 | 0.20% | |||
| Rocky De La Fuente | 870 | 0.07% | |||
| Total | 1,205,552 | 100% | 130 | 17 | 147 |
| Source: [22] | |||||
| Michigan Democratic primary, March 8, 2016 | |||||||
|---|---|---|---|---|---|---|---|
| District | Delegates | Votes Clinton | Votes Sanders | Votes Qualified | Clinton delegates | Sanders delegates | |
| 1 | 6 | 28,860 | 44,359 | 73,219 | 2 | 4 | |
| 2 | 5 | 26,090 | 39,834 | 65,924 | 2 | 3 | |
| 3 | 5 | 28,441 | 45,282 | 73,723 | 2 | 3 | |
| 4 | 5 | 24,928 | 35,597 | 60,525 | 2 | 3 | |
| 5 | 7 | 48,622 | 42,755 | 91,377 | 4 | 3 | |
| 6 | 5 | 28,265 | 39,157 | 67,422 | 2 | 3 | |
| 7 | 5 | 29,186 | 36,019 | 65,205 | 2 | 3 | |
| 8 | 5 | 35,205 | 46,969 | 82,174 | 2 | 3 | |
| 9 | 6 | 48,570 | 50,903 | 99,473 | 3 | 3 | |
| 10 | 5 | 28,314 | 33,710 | 62,024 | 2 | 3 | |
| 11 | 6 | 39,732 | 45,054 | 84,786 | 3 | 3 | |
| 12 | 7 | 50,157 | 58,892 | 109,049 | 3 | 4 | |
| 13 | 9 | 71,235 | 37,028 | 108,263 | 6 | 3 | |
| 14 | 9 | 88,494 | 42,608 | 131,102 | 6 | 3 | |
| Total | 85 | 581,775 | 598,943 | 1,180,718 | 41 | 44 | |
| PLEO | 17 | 581,775 | 598,943 | 1,180,718 | 8 | 9 | |
| At Large | 28 | 581,775 | 598,943 | 1,180,718 | 14 | 14 | |
| Gr. Total | 130 | 581,775 | 598,943 | 1,180,718 | 63 | 67 | |
| Total vote | 1,205,552 | 48.26% | 49.68% | ||||
| Source: Michigan Department of State Election results (District 13 and 14 Wayne County) partial | |||||||
Results by county
edit| County | Clinton | % | Sanders | % | Others | Totals | Turnout | Margin |
|---|---|---|---|---|---|---|---|---|
| Alcona | 463 | 48.74% | 455 | 47.89% | 26 | 947 | 30.60% | -0.84% |
| Alger | 384 | 37.07% | 622 | 60.64% | 26 | 1,035 | 44.61% | 23.00% |
| Allegan | 3,511 | 38.01% | 5,569 | 60.28% | 16 | 9,050 | 11.28% | 22.29% |
| Alpena | 1,102 | 44.26% | 1,347 | 54.10% | 26 | 2,478 | 36.51% | 9.89% |
| Antrim | 867 | 36.09% | 1,491 | 62.07% | 39 | 2,400 | 32.72% | 26.00% |
| Arenac | 595 | 46.12% | 663 | 51.40% | 24 | 1,285 | 35.89% | 5.29% |
| Baraga | 270 | 40.36% | 371 | 55.46% | 25 | 669 | 37.93% | 15.10% |
| Barry | 1,736 | 35.41% | 3,078 | 62.79% | 74 | 4,891 | 31.62% | 27.44% |
| Bay | 5,937 | 45.98% | 6,363 | 49.28% | 555 | 12,858 | 47.83% | 3.31% |
| Benzie | 853 | 33.48% | 1,650 | 64.76% | 43 | 2,549 | 44.66% | 31.27% |
| Berrien | 6,698 | 51.54% | 5,968 | 45.93% | 285 | 12,954 | 36.25% | -5.64% |
| Branch | 1,010 | 43.44% | 1,246 | 53.59% | 59 | 2,318 | 27.23% | 10.18% |
| Calhoun | 5,231 | 46.36% | 5,812 | 51.51% | 201 | 11,247 | 41.28% | 5.17% |
| Cass | 1,657 | 48.37% | 1,684 | 49.15% | 69 | 3,413 | 31.70% | 0.79% |
| Charlevoix | 1,044 | 36.73% | 1,730 | 60.87% | 58 | 2,835 | 36.23% | 24.20% |
| Cheboygan | 1,010 | 42.62% | 1,318 | 55.61% | 36 | 2,367 | 34.21% | 13.01% |
| Chippewa | 1,230 | 39.83% | 1,793 | 58.06% | 55 | 3,081 | 38.49% | 18.27% |
| Clare | 1,090 | 45.76% | 1,239 | 52.02% | 43 | 2,375 | 35.01% | 6.27% |
| Clinton | 3,402 | 42.16% | 4,496 | 55.72% | 150 | 8,051 | 38.76% | 13.59% |
| Crawford | 494 | 42.33% | 631 | 54.07% | 36 | 1,164 | 33.90% | 11.77% |
| Delta | 1,409 | 43.34% | 1,705 | 52.45% | 122 | 3,239 | 39.53% | 9.14% |
| Dickinson | 908 | 43.51% | 1,075 | 51.51% | 99 | 2,085 | 30.20% | 8.01% |
| Eaton | 5,866 | 43.99% | 7,125 | 53.43% | 298 | 13,292 | 44.13% | 9.47% |
| Emmet | 1,369 | 33.91% | 2,589 | 64.13% | 68 | 4,029 | 14.48% | 30.28% |
| Genesee | 31,366 | 51.75% | 28,171 | 46.48% | 946 | 60,486 | 59.79% | -5.28% |
| Gladwin | 985 | 46.33% | 1,083 | 50.94% | 46 | 2,117 | 33.72% | |
| Gogebic | 678 | 44.90% | 790 | 52.32% | 38 | 1,509 | 46.65% | |
| Grand Traverse | 4,140 | 33.19% | 8,091 | 64.86% | 206 | 12,440 | 41.56% | |
| Gratiot | 1,185 | 38.87% | 1,812 | 59.43% | 42 | 3,042 | 38.52% | |
| Hillsdale | 977 | 40.17% | 1,380 | 56.74% | 59 | 2,419 | 24.31% | |
| Houghton | 1,109 | 34.79% | 2,039 | 63.96% | 35 | 3,186 | 41.79% | |
| Huron | 1,050 | 45.99% | 1,184 | 51.86% | 36 | 2,273 | 29.30% | |
| Ingham | 17,884 | 43.49% | 22,580 | 54.91% | 562 | 41,029 | 59.65% | |
| Ionia | 1,491 | 33.99% | 2,812 | 64.11% | 62 | 4,368 | 34.63% | |
| Iosco | 1,077 | 46.08% | 1,202 | 51.43% | 54 | 2,336 | 37.45% | |
| Iron | 527 | 48.30% | 546 | 50.05% | 18 | 1,094 | 36.11% | |
| Isabella | 2,032 | 33.19% | 4,024 | 65.72% | 55 | 6,114 | 49.53% | |
| Jackson | 5,288 | 42.72% | 6,804 | 54.97% | 230 | 12,325 | 37.16% | |
| Kalamazoo | 12,611 | 37.92% | 20,162 | 60.63% | 408 | 33,184 | 50.40% | |
| Kalkaska | 590 | 35.53% | 987 | 61.11% | 30 | 1,610 | 30.46% | |
| Kent | 26,032 | 36.86% | 43,444 | 61.52% | 987 | 70,506 | ||
| Keweenaw | 128 | 39.75% | 188 | 58.39% | 6 | 325 | ||
| Lake | 548 | 50.14% | 514 | 47.03% | 30 | 1,095 | ||
| Lapeer | 3,325 | 40.39% | 4,650 | 56.49% | 221 | 8,199 | ||
| Leelanau | 1,459 | 37.67% | 2,360 | 60.93% | 44 | 3,866 | ||
| Lenawee | 3,455 | 43.73% | 4,256 | 53.87% | 163 | 7,877 | ||
| Livingston | 6,705 | 38.14% | 10,435 | 59.35% | 396 | 17,539 | ||
| Luce | 167 | 35.46% | 291 | 61.78% | 11 | 472 | ||
| Mackinac | 500 | 42.77% | 633 | 54.15% | 29 | 1,165 | ||
| Macomb | 47,599 | 48.80% | 46,248 | 47.42% | 2,534 | 71,008 | ||
| Manistee | 1,120 | 39.63% | 1,646 | 58.24% | 51 | 2,820 | ||
| Marquette | 3,188 | 35.59% | 5,530 | 61.74% | 203 | 8,924 | ||
| Mason | 1,223 | 40.56% | 1,741 | 57.24% | 38 | 2,772 | ||
| Mecosta | 1,173 | 38.88% | 1,768 | 58.60% | 63 | 3,007 | ||
| Menominee | 835 | 48.72% | 805 | 46.97% | 64 | 1,707 | ||
| Midland | 3,097 | 39.81% | 4,568 | 58.71% | 88 | 7,756 | ||
| Missaukee | 401 | 39.08% | 591 | 57.60% | 33 | 1,028 | ||
| Monroe | 6,716 | 47.25% | 6,842 | 48.13% | 595 | 14,156 | ||
| Montcalm | 1,681 | 36.85% | 2,762 | 60.54% | ||||
| Montmorency | 392 | 48.70% | 383 | 47.58% | ||||
| Muskegon | 8,807 | 44.53% | 10,456 | 52.86% | ||||
| Newaygo | 1,295 | 36.49% | 2,155 | 60.72% | ||||
| Oakland | 92,300 | 51.38% | 84,163 | 46.85% | ||||
| Oceana | 791 | 38.21% | 1,237 | 59.76% | ||||
| Ogemaw | 862 | 46.24% | 926 | 49.68% | ||||
| Ontonagon | 327 | 44.37% | 362 | 49.12% | ||||
| Osceola | 670 | 40.39% | 953 | 57.44% | ||||
| Oscoda | 273 | 44.90% | 315 | 51.81% | ||||
| Otsego | 786 | 37.97% | 1,228 | 59.5% | ||||
| Ottawa | 7,473 | 34.39% | 13,959 | 64.24% | ||||
| Presque Isle | 592 | 47.70% | 606 | 48.83% | ||||
| Roscommon | 1,163 | 47.33% | 1,187 | 48.31% | ||||
| Saginaw | 12,490 | 55.32% | 9,676 | 42.86% | ||||
| St. Clair | 5,973 | 40.96% | 8,347 | 56.54% | ||||
| St. Joseph | 1,382 | 37.66% | 2,219 | 60.46% | ||||
| Sanilac | 1,160 | 42.00% | 1,485 | 53.77% | ||||
| Schoolcraft | 312 | 45.75% | 345 | 50.59% | ||||
| Shiawassee | 3,031 | 39.38% | 4,452 | 57.84% | ||||
| Tuscola | 1,984 | 42.65% | 2,532 | 54.43% | ||||
| Van Buren | 2,484 | 39.73% | 3,656 | 58.48% | ||||
| Washtenaw | 30,022 | 43.70% | 38,062 | 55.41% | ||||
| Wayne | 165,819 | 60.11% | 105,487 | 38.24% | ||||
| Wexford | 909 | 32.95% | 1,793 | 64.99% | ||||
| Total | 581,775 | 48.26% | 598,943 | 49.68% |
Results by congressional district
edit| District | Sanders | Clinton |
|---|---|---|
| 1st | 59.09% | 38.44% |
| 2nd | 59.24% | 38.80% |
| 3rd | 60.38% | 37.92% |
| 4th | 57.48% | 40.26% |
| 5th | 45.77% | 52.05% |
| 6th | 57.03% | 41.17% |
| 7th | 53.72% | 43.53% |
| 8th | 56.00% | 41.97% |
| 9th | 49.75% | 47.47% |
| 10th | 52.32% | 43.95% |
| 11th | 52.11% | 45.95% |
| 12th | 53.09% | 45.22% |
| 13th | 33.74% | 64.92% |
| 14th | 32.10% | 66.66% |
Analysis
editBernie Sanders's narrow, one-point win in Michigan was seen as a major upset for the Clinton campaign, since Bernie Sanders had never led a poll in that state. Many theories about the failure of the Michigan polling circulated throughout the media, with most centering on pollsters' erroneous assumptions about the composition of the electorate stemming from the 2008 primary in Michigan not having been contested due to an impasse between the state party and DNC.[73][74][75] Although Clinton expanded her delegate lead with a lopsided victory in Mississippi that same day, some journalists suggested Sanders' upset might presage her defeat in other delegate-rich Midwestern Rust Belt states,[76] such as Missouri, Ohio and Illinois, who voted a week later on March 15, along with North Carolina and Florida, where Clinton was more clearly favored.[77][78]
Sanders beat Clinton among white voters in Michigan, who made up 70% of the electorate, by a margin of 56–42, a margin perhaps larger than the Clinton campaign had anticipated. Independents, who made up 27% of the electorate, backed Sanders 71–28. As was true in other primaries, Clinton won the votes of women and African Americans, but Sanders's margins with Independents and rural voters, mostly working class whites who felt disaffected and disenfranchised by trade deals championed by Hillary Clinton and her husband,[23] were not able to be surpassed, even by Clinton's large leads in major cities such as Detroit and Flint. Among voters who said their primary concern was the U.S. economy, Sanders won 56–40, even though Clinton had hammered him on his 2009 vote against the auto-bailout which she believed would resonate in a state whose economy depended upon manufacturing and the auto industry. Among unions, Sanders had beaten Clinton 49–46, even though in previous contests union households had broken for Clinton.[24] Hand-wringing began on the Clinton side, with the campaign worrying they turned their attention to the general election too soon, as Hillary Clinton had pleaded "the sooner I could become your nominee, the more I could begin to turn my attention to the Republicans."[23]
Sanders thanked supporters after his surprise win, "What tonight means is that the Bernie Sanders campaign, the people's revolution that we're talking about, the political revolution that we're talking about, is strong in every part of the country [...] And, frankly, we believe our strongest areas are yet to happen."[23]
Clinton went on to win the next five states in the Democratic primary, including Ohio, Illinois and Missouri.
Alongside Wisconsin, Michigan was among the two "Blue Wall" states won by Bernie Sanders in the primary election that Donald Trump would ultimately flip in the 2016 United States Presidential Election.
References
edit- ^ "Election 2016 - Michigan Democratic Presidential Primary". realclearpolitics.com. Retrieved May 28, 2016.
- ^ "Flint gets Democratic presidential debate on March 6". Detroit News. February 3, 2016. Retrieved February 3, 2016.
- ^ Feldman, Josh. "Fox News Will Hold Democratic Town Hall Next Week; Only One Candidate Set to Appear". MSN. Archived from the original on March 7, 2016. Retrieved March 4, 2016.
- ^ Official Primary results
- ^ "Michigan Democratic Presidential Primary".
- ^ "Clinton Opens Up Huge Lead in Michigan" (PDF).
- ^ "MICHIGAN: TRUMP, CLINTON IN FRONT" (PDF).
- ^ a b "Michigan Democratic Presidential Primary".
- ^ "Clinton's lead on Sanders shrinks heading into Michigan Primary".
- ^ "Donald Trump, Hillary Clinton Hold Big Leads in Michigan: Poll".
- ^ "TRUMP LEADS GOP FIELD IN MICHIGAN; DEMOCRATIC RACE CLOSE".
- ^ "Clinton, Trump maintain large leads ahead of debates, primary".
- ^ "Trump & Clinton Poised to Take Michigan" (PDF).
- ^ "Clinton Leads Sanders by 34% February 23, 2016" (PDF).
- ^ "ARG POll February 19–20, 2016".
- ^ "Clinton Leads Sanders by 33%" (PDF). realclearpolitics.com. Retrieved February 20, 2016.
- ^ "Subject: Clinton leads in 10 of 12 Early March Primaries; Benefits From Overwhelming Black Support" (PDF).
- ^ a b "IMP/Target Insyght Poll: Clinton Dominates Dem Primary". insidemichiganpolitics.com. Retrieved February 8, 2016.
- ^ "Hillary up 19 over Biden and Sanders". mrgmi.com. Retrieved September 16, 2015.
- ^ "PPP MI" (PDF). publicpolicypolling.com. Retrieved July 9, 2015.
- ^ Suffolk
- ^ The Green Papers
- ^ a b c Lee, MJ; Zeleny, Jeff; Bash, Dana; Merica, Dan. "What went wrong for Hillary Clinton?". CNN. Retrieved September 25, 2016.
- ^ "2016 Election Center". CNN. Retrieved September 25, 2016.


