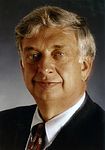
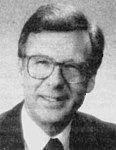
The 1992 Washington gubernatorial election was held on November 3, 1992. Incumbent Democratic Governor Booth Gardner chose not to run for a third term. This resulted in an open race for Governor of Washington in which Democrat Mike Lowry narrowly defeated Republican Ken Eikenberry. This is the last time that a gubernatorial nominee and a lieutenant gubernatorial nominee of different political parties were elected governor and lieutenant governor of Washington.
| |||||||||||||||||
| |||||||||||||||||
 County results Lowry: 50–60% 60–70% Eikenberry: 50–60% 60–70% 70–80% | |||||||||||||||||
| |||||||||||||||||
Primary election
editCandidates
editDemocratic
edit- Mike Lowry, former U.S. Representative for the 7th congressional district and unsuccessful Democratic nominee for the United States Senate in 1988
- Joseph E. King, speaker state representative
- Sally McQuown
- Richard "Onery Dick" Short
- Wayne Madsen
Republican
edit- Ken Eikenberry, State Attorney General
- Sid Morrison, U.S. Representative for the 4th congressional district
- Dan McDonald, state senator
- Bob Tharp
Results
edit Lowry
- 20–30%
- 30–40%
Eikenberry
- 20–30%
- 30–40%
Morrison
- 20–30%
- 30–40%
- 40–50%
- 50–60%
- 60–70%
- 70–80%
King
- 20–30%
| Party | Candidate | Votes | % | |
|---|---|---|---|---|
| Democratic | Mike Lowry | 337,783 | 29.23% | |
| Republican | Ken Eikenberry | 258,553 | 22.37% | |
| Republican | Sid Morrison | 250,418 | 21.67% | |
| Republican | Dan McDonald | 144,050 | 12.47% | |
| Democratic | Joseph E. King | 96,480 | 8.35% | |
| Democratic | Sally McQuown | 31,175 | 2.70% | |
| Democratic | Richard "Onery Dick" Short | 8,470 | 0.73% | |
| Republican | Bob Tharp | 8,103 | 0.70% | |
| Democratic | Wayne Madsen | 7,860 | 0.68% | |
| Independent | Mike The Mover | 6,645 | 0.58% | |
| Socialist Workers | Kathleen Wheeler | 6,068 | 0.53% | |
| Total votes | 1,155,605 | 100.00% | ||
General election
editCandidates
edit- Mike Lowry (D), former U.S. Representative for the 7th congressional district
- Ken Eikenberry (R), State Attorney General
Debates
edit- Complete video of debate, October 27, 1992 - C-SPAN
Polling
edit| Poll source | Date(s) administered |
Sample size |
Margin of error |
Mike Lowry (D) |
Ken Eikenberry (R) |
Undecided |
|---|---|---|---|---|---|---|
| Tacoma News Tribune[3] | October 1992 | – | – | 47% | 43% | 10% |
Endorsements
editMike Lowry (D)
Federal officials
- Sid Morrison, U.S. Representative from Washington's 4th congressional district (Republican)[4]
Results
edit| Party | Candidate | Votes | % | ±% | |
|---|---|---|---|---|---|
| Democratic | Mike Lowry | 1,184,315 | 52.16% | −10.05% | |
| Republican | Ken Eikenberry | 1,086,216 | 47.84% | +10.05% | |
| Majority | 98,099 | 4.32% | |||
| Total votes | 2,270,531 | 100.00% | |||
| Democratic hold | Swing | -20.11% | |||
Results by county
editKen Eikenberry is the last Republican to have carried Whatcom County in a gubernatorial election; this election is the only one since 1960 in which Whatcom County has backed the losing candidate.
| County[6] | Mike Lowry Democratic |
Ken Eikenberry Republican |
Margin | Total votes cast | |||
|---|---|---|---|---|---|---|---|
| # | % | # | % | # | % | ||
| Adams | 1,750 | 38.40% | 2,807 | 61.60% | -1,057 | -23.20% | 4,557 |
| Asotin | 3,436 | 45.99% | 4,035 | 54.01% | -599 | -8.02% | 7,471 |
| Benton | 21,872 | 42.48% | 29,614 | 57.52% | -7,742 | -15.04% | 51,486 |
| Chelan | 8,666 | 37.60% | 14,379 | 62.40% | -5,713 | -24.79% | 23,045 |
| Clallam | 12,049 | 42.46% | 16,330 | 57.54% | -4,281 | -15.09% | 28,379 |
| Clark | 48,292 | 46.40% | 55,780 | 53.60% | -7,488 | -7.20% | 104,072 |
| Columbia | 599 | 31.33% | 1,313 | 68.67% | -714 | -37.34% | 1,912 |
| Cowlitz | 16,677 | 48.97% | 17,381 | 51.03% | -704 | -2.07% | 34,058 |
| Douglas | 4,139 | 37.89% | 6,785 | 62.11% | -2,646 | -24.22% | 10,924 |
| Ferry | 1,062 | 42.13% | 1,459 | 57.87% | -397 | -15.75% | 2,521 |
| Franklin | 5,474 | 45.60% | 6,531 | 54.40% | -1,057 | -8.80% | 12,005 |
| Garfield | 426 | 32.67% | 878 | 67.33% | -452 | -34.66% | 1,304 |
| Grant | 7,991 | 36.86% | 13,688 | 63.14% | -5,697 | -26.28% | 21,679 |
| Grays Harbor | 14,986 | 55.41% | 12,060 | 44.59% | 2,926 | 10.82% | 27,046 |
| Island | 12,429 | 45.81% | 14,704 | 54.19% | -2,275 | -8.38% | 27,133 |
| Jefferson | 7,047 | 54.77% | 5,820 | 45.23% | 1,227 | 9.54% | 12,867 |
| King | 466,506 | 60.44% | 305,326 | 39.56% | 161,180 | 20.88% | 771,832 |
| Kitsap | 42,562 | 48.69% | 44,852 | 51.31% | -2,290 | -2.62% | 87,414 |
| Kittitas | 6,232 | 51.04% | 5,978 | 48.96% | 254 | 2.08% | 12,210 |
| Klickitat | 2,883 | 43.45% | 3,752 | 56.55% | 869 | 13.10% | 6,635 |
| Lewis | 7,938 | 29.46% | 19,003 | 70.54% | -11,065 | -41.07% | 26,941 |
| Lincoln | 1,717 | 34.76% | 3,223 | 65.24% | -1,506 | -30.49% | 4,940 |
| Mason | 9,548 | 48.57% | 10,111 | 51.43% | -563 | -2.86% | 19,659 |
| Okanogan | 5,139 | 39.99% | 7,712 | 60.01% | -2,573 | -20.02% | 12,851 |
| Pacific | 4,933 | 53.70% | 4,254 | 46.30% | 679 | 7.39% | 9,187 |
| Pend Oreille | 1,919 | 41.31% | 2,726 | 58.69% | -807 | -17.37% | 4,645 |
| Pierce | 120,968 | 50.70% | 117,623 | 49.30% | 3,345 | 1.40% | 238,591 |
| San Juan | 3,758 | 54.61% | 3,123 | 45.39% | 635 | 9.23% | 6,881 |
| Skagit | 18,784 | 46.56% | 21,560 | 53.44% | -2,776 | -6.88% | 40,344 |
| Skamania | 1,657 | 46.81% | 1,883 | 53.19% | -226 | -6.38% | 3,540 |
| Snohomish | 117,000 | 52.42% | 106,196 | 47.58% | 10,804 | 4.84% | 223,196 |
| Spokane | 74,262 | 44.33% | 93,269 | 55.67% | -19,007 | -11.35% | 167,531 |
| Stevens | 5,447 | 37.15% | 9,217 | 62.85% | -3,770 | -25.71% | 14,664 |
| Thurston | 46,666 | 55.75% | 37,038 | 44.25% | 9,628 | 11.50% | 83,704 |
| Wahkiakum | 775 | 44.51% | 966 | 55.49% | -191 | -10.97% | 1,741 |
| Walla Walla | 8,330 | 42.36% | 11,333 | 57.64% | -3,003 | -15.27% | 19,663 |
| Whatcom | 31,113 | 49.49% | 31,756 | 50.51% | -643 | -1.02% | 62,869 |
| Whitman | 8,459 | 48.78% | 8,883 | 51.22% | -424 | -2.44% | 17,342 |
| Yakima | 30,824 | 48.40% | 32,868 | 51.60% | -2,044 | -3.21% | 63,692 |
| Totals | 1,184,315 | 52.16% | 1,086,216 | 47.84% | 98,099 | 4.32% | 2,270,531 |
Counties that flipped from Democratic to Republican
editReferences
edit- ^ "Elections Search Results September 1992 Primary". Washington Secretary of State. Retrieved August 12, 2024.
- ^ Washington Secretary of State. "Governor". Official Abstract for the 1992 Primary Election. Olympia, Washington.
- ^ Tacoma News Tribune
- ^ "'92'S Odd Governor's Race -- While Eikenberry Sounds Populist, Lowry's Wooing Rotary Clubbers". October 26, 1992.
- ^ "Elections Search Results November 1992 General". Washington Secretary of State. Retrieved August 12, 2024.
- ^ a b Washington Secretary of State. "Governor". Official Returns of the State General Election November 3, 1992. Olympia, Washington.

