Elections to the European Parliament in Ireland – 1989
| Party
|
European Party
|
Party Leader
|
1st Pref Vote
|
%
|
±%
|
Seats
|
±
|
|
|
Fianna Fáil
|
EDA
|
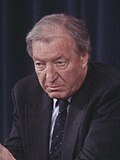
Charles Haughey
|
514,537
|
31.5
|
−7.7
|
6
|
−2
|
|
|
Fine Gael
|
EPP
|
Alan Dukes
|
353,094
|
21.6
|
−10.6
|
4
|
−2
|
|
|
Progressive Democrats
|
ELDR
|
Desmond O'Malley
|
194,059
|
12.0
|
+12.0
|
1
|
+1
|
|
|
Labour Party
|
SOC
|
Dick Spring
|
155,572
|
9.5
|
+1.2
|
1
|
+1
|
|
|
Workers' Party
|
Left Unity
|
Proinsias De Rossa
|
124,679
|
7.7
|
+3.4
|
1
|
+1
|
|
|
Independent Fianna Fáil
|
RBW
|
Neil Blaney
|
52,852
|
3.2
|
+0.3
|
1
|
+1
|
|
|
Green Party
|
Green Group
|
none
|
61,041
|
3.7
|
+3.2
|
0
|
±0
|
|
|
Sinn Féin
|
|
Gerry Adams
|
35,923
|
2.2
|
−2.7
|
0
|
±0
|
|
|
Independent
|
140,971
|
8.6
|
+0.9
|
1
|
±0
|
| Total
|
1,632,728
|
100.0
|
—
|
15
|
—
|
1979–2004 European Parliament Ireland constituencies
| Constituency
|
Electorate
|
Turnout
|
Spoilt
|
Valid Poll
|
Quota
|
Seats
|
Candidates
|
| Connacht–Ulster
|
464,661
|
322,664 (69.4%)
|
10,362 (3.2%)
|
312,302
|
78,076
|
3
|
13
|
| Dublin
|
711,416
|
455,539 (64.0%)
|
7,137 (1.5%)
|
448,402
|
89,681
|
4
|
11
|
| Leinster
|
571,694
|
391,697 (68.5%)
|
14,106 (3.6%)
|
377,591
|
94,398
|
3
|
15
|
| Munster
|
703,913
|
505,219 (71.7%)
|
10,786 (2.2%)
|
494,433
|
82,406
|
5
|
15
|
| Total
|
2,451,684
|
1,675,119 (68.3%)
|
42,391 (2.6%)
|
1,632,728
|
—
|
15
|
44
|


