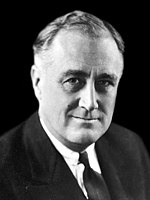
The 1936 United States presidential election in Maryland took place on November 3, 1936, as part of the 1936 United States presidential election. State voters chose eight[2] representatives, or electors, to the Electoral College, who voted for president and vice president.
| ||||||||||||||||||||||||||
All 8 Maryland votes to the Electoral College | ||||||||||||||||||||||||||
|---|---|---|---|---|---|---|---|---|---|---|---|---|---|---|---|---|---|---|---|---|---|---|---|---|---|---|
| ||||||||||||||||||||||||||
 County Results
| ||||||||||||||||||||||||||
| ||||||||||||||||||||||||||
Maryland was won by incumbent President Franklin D. Roosevelt (D–New York), running with Vice President John Nance Garner, with 62.35% of the popular vote, against Governor Alf Landon (R–Kansas), running with Frank Knox, with 37.04% of the popular vote.[3][4]
Maryland weighed in for this election as Roosevelt’s strongest performance in any of the border states. In this election, Maryland voted 1.06% to the left of the nation at-large.[5]
Results
edit| Party | Candidate | Votes | % | |
|---|---|---|---|---|
| Democratic | Franklin D. Roosevelt (inc.) | 389,612 | 62.35% | |
| Republican | Alf Landon | 231,435 | 37.04% | |
| Socialist | Norman Thomas | 1,629 | 0.26% | |
| Socialist Labor | John Aiken | 1,305 | 0.21% | |
| Communist | Earl Browder | 915 | 0.15% | |
| Total votes | 624,896 | 100% | ||
Results by county
edit| County | Franklin Delano Roosevelt Democratic |
Alfred Mossman Landon Republican |
Various candidates Other parties |
Margin | Total votes cast[6] | ||||
|---|---|---|---|---|---|---|---|---|---|
| # | % | # | % | # | % | # | % | ||
| Allegany | 19,721 | 63.20% | 11,191 | 35.87% | 291 | 0.93% | 8,530 | 27.34% | 31,203 |
| Anne Arundel | 11,413 | 56.97% | 8,478 | 42.32% | 142 | 0.71% | 2,935 | 14.65% | 20,033 |
| Baltimore | 28,367 | 59.62% | 18,893 | 39.71% | 316 | 0.66% | 9,474 | 19.91% | 47,576 |
| Baltimore City | 210,668 | 67.89% | 97,667 | 31.48% | 1,959 | 0.63% | 113,001 | 36.42% | 310,294 |
| Calvert | 1,872 | 47.05% | 2,082 | 52.32% | 25 | 0.63% | -210 | -5.28% | 3,979 |
| Caroline | 3,579 | 57.67% | 2,611 | 42.07% | 16 | 0.26% | 968 | 15.60% | 6,206 |
| Carroll | 6,496 | 46.54% | 7,383 | 52.90% | 78 | 0.56% | -887 | -6.36% | 13,957 |
| Cecil | 4,914 | 57.26% | 3,617 | 42.15% | 51 | 0.59% | 1,297 | 15.11% | 8,582 |
| Charles | 2,597 | 49.15% | 2,623 | 49.64% | 64 | 1.21% | -26 | -0.49% | 5,284 |
| Dorchester | 5,293 | 58.56% | 3,735 | 41.32% | 11 | 0.12% | 1,558 | 17.24% | 9,039 |
| Frederick | 10,722 | 52.85% | 9,500 | 46.83% | 64 | 0.32% | 1,222 | 6.02% | 20,286 |
| Garrett | 3,252 | 44.11% | 4,057 | 55.03% | 64 | 0.87% | -805 | -10.92% | 7,373 |
| Harford | 6,165 | 53.46% | 5,327 | 46.20% | 39 | 0.34% | 838 | 7.27% | 11,531 |
| Howard | 4,138 | 60.63% | 2,638 | 38.65% | 49 | 0.72% | 1,500 | 21.98% | 6,825 |
| Kent | 2,931 | 53.22% | 2,543 | 46.18% | 33 | 0.60% | 388 | 7.05% | 5,507 |
| Montgomery | 13,246 | 56.29% | 10,133 | 43.06% | 153 | 0.65% | 3,113 | 13.23% | 23,532 |
| Prince George's | 15,087 | 64.76% | 8,107 | 34.80% | 101 | 0.43% | 6,980 | 29.96% | 23,295 |
| Queen Anne's | 3,548 | 64.47% | 1,946 | 35.36% | 9 | 0.16% | 1,602 | 29.11% | 5,503 |
| Somerset | 4,116 | 45.95% | 4,770 | 53.25% | 72 | 0.80% | -654 | -7.30% | 8,958 |
| St. Mary's | 2,829 | 54.00% | 2,286 | 43.63% | 124 | 2.37% | 543 | 10.36% | 5,239 |
| Talbot | 3,768 | 51.16% | 3,578 | 48.58% | 19 | 0.26% | 190 | 2.58% | 7,365 |
| Washington | 14,050 | 56.84% | 10,619 | 42.96% | 49 | 0.20% | 3,431 | 13.88% | 24,718 |
| Wicomico | 7,273 | 61.05% | 4,545 | 38.15% | 95 | 0.80% | 2,728 | 22.90% | 11,913 |
| Worcester | 3,567 | 53.25% | 3,106 | 46.37% | 25 | 0.37% | 461 | 6.88% | 6,698 |
| Totals | 389,612 | 62.35% | 231,435 | 37.04% | 3,849 | 0.62% | 158,177 | 25.31% | 624,896 |
Counties that flipped from Democratic to Republican
editSee also
editReferences
edit- ^ "United States Presidential election of 1936 - Encyclopædia Britannica". Retrieved January 15, 2019.
- ^ "1936 Election for the Thirty-eighth Term (1937-41)". Retrieved January 15, 2019.
- ^ "1936 Presidential General Election Results – Maryland". Retrieved January 15, 2019.
- ^ "The American Presidency Project – Election of 1936". Retrieved January 15, 2019.
- ^ "Dave Leip's Atlas of U.S. Presidential Elections". uselectionatlas.org. Retrieved October 15, 2022.
- ^ Scammon, Richard M. (compiler); America at the Polls: A Handbook of Presidential Election Statistics 1920-1964; p. 208 ISBN 0405077114

