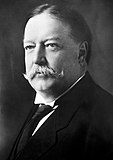
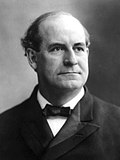
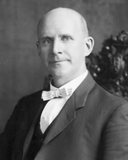
The 1908 United States presidential election in Washington took place on November 3, 1908. All contemporary 46 states were part of the 1908 United States presidential election. Voters chose five electors to the Electoral College, which selected the president and vice president.
| |||||||||||||||||||||||||||||||||
| |||||||||||||||||||||||||||||||||
 County Results
Taft 40-50% 50-60% 60-70% 70-80%
| |||||||||||||||||||||||||||||||||
| |||||||||||||||||||||||||||||||||
Washington had been established earlier in the 1900s as a one-party Republican bastion, which it would remain at a Presidential level apart from the 1910s GOP split until Franklin D. Roosevelt rose to power in 1932, and more or less continuously at state level during this era.[1] Democratic representation in the Washington legislature would during this period at times be countable on one hand.[2] Republican primaries would take over as the chief mode of political competition when introduced later in the decade.[3]
Roosevelt's great popularity in the state ensured his handpicked successor William Howard Taft would win Washington by a margin of 25.76% and without much difficulty, although because Democratic presidential candidate William Jennings Bryan retained some popularity from previous campaigns in this radical state, Taft could not equal Roosevelt's huge win from four years earlier. Bryan had previously won the state against William McKinley in 1896 but would later lose the state to McKinley in 1900.
Results
edit| Party | Pledged to | Elector | Votes | |
|---|---|---|---|---|
| Republican Party | William Howard Taft | John R. O'Donnell | 106,062 | |
| Republican Party | William Howard Taft | William Pitt Trimble | 105,731 | |
| Republican Party | William Howard Taft | J. M. Fish | 105,709 | |
| Republican Party | William Howard Taft | Frank M. Dallam | 105,580 | |
| Republican Party | William Howard Taft | Charles E. Curlee | 105,519 | |
| Democratic Party | William Jennings Bryan | W. J. Byham | 58,691 | |
| Democratic Party | William Jennings Bryan | N. K. Mead | 58,437 | |
| Democratic Party | William Jennings Bryan | J. M. McKeirnan | 58,383 | |
| Democratic Party | William Jennings Bryan | Wilmon Tucker | 58,293 | |
| Democratic Party | William Jennings Bryan | Frank M. Lamborn | 58,206 | |
| Socialist Party | Eugene V. Debs | J. W. Morris | 14,177 | |
| Socialist Party | Eugene V. Debs | J. G. Elliott | 14,151 | |
| Socialist Party | Eugene V. Debs | J. E. Janes | 14,117 | |
| Socialist Party | Eugene V. Debs | W. H. Harris | 14,114 | |
| Socialist Party | Eugene V. Debs | C. L. Whiting | 14,104 | |
| Prohibition Party | Eugene W. Chafin | T. E. Webb | 4,700 | |
| Prohibition Party | Eugene W. Chafin | J. W. Lockhart | 4,689 | |
| Prohibition Party | Eugene W. Chafin | H. C. Byron | 4,687 | |
| Prohibition Party | Eugene W. Chafin | W. B. Eakin | 4,675 | |
| Prohibition Party | Eugene W. Chafin | C. C. Gridley | 4,664 | |
| Independence Party | Thomas L. Hisgen | Homer O. Campbell | 249 | |
| Independence Party | Thomas L. Hisgen | George W. McCauley | 249 | |
| Independence Party | Thomas L. Hisgen | Thomas G. Albin | 248 | |
| Independence Party | Thomas L. Hisgen | Joseph C. Sharp | 244 | |
| Independence Party | Thomas L. Hisgen | W. L. Woodring | 243 | |
| Votes cast[a] | 183,879 | |||
Results by county
edit| County | William Howard Taft Republican |
William Jennings Bryan Democratic |
Eugene V. Debs Socialist |
Eugene W. Chafin Prohibition |
Thomas L. Hisgen Independence |
Margin | Total votes cast[b] | ||||||
|---|---|---|---|---|---|---|---|---|---|---|---|---|---|
| # | % | # | % | # | % | # | % | # | % | # | % | ||
| Adams | 1,033 | 55.81% | 714 | 38.57% | 58 | 3.13% | 45 | 2.43% | 1 | 0.05% | 319 | 17.23% | 1,851 |
| Asotin | 648 | 59.61% | 365 | 33.58% | 36 | 3.31% | 38 | 3.50% | 0 | 0.00% | 283 | 26.03% | 1,087 |
| Benton | 891 | 57.74% | 465 | 30.14% | 151 | 9.79% | 34 | 2.20% | 2 | 0.13% | 426 | 27.61% | 1,543 |
| Chehalis | 3,128 | 60.35% | 1,248 | 24.08% | 712 | 13.74% | 86 | 1.66% | 9 | 0.17% | 1,880 | 36.27% | 5,183 |
| Chelan | 1,639 | 59.71% | 871 | 31.73% | 160 | 5.83% | 66 | 2.40% | 9 | 0.33% | 768 | 27.98% | 2,745 |
| Clallam | 938 | 59.59% | 428 | 27.19% | 187 | 11.88% | 11 | 0.70% | 10 | 0.64% | 510 | 32.40% | 1,574 |
| Clark | 2,416 | 58.83% | 1,250 | 30.44% | 335 | 8.16% | 104 | 2.53% | 2 | 0.05% | 1,166 | 28.39% | 4,107 |
| Columbia | 887 | 57.41% | 585 | 37.86% | 25 | 1.62% | 48 | 3.11% | 0 | 0.00% | 302 | 19.55% | 1,545 |
| Cowlitz | 1,573 | 65.65% | 617 | 25.75% | 172 | 7.18% | 28 | 1.17% | 6 | 0.25% | 956 | 39.90% | 2,396 |
| Douglas | 1,942 | 52.20% | 1,540 | 41.40% | 191 | 5.13% | 43 | 1.16% | 4 | 0.11% | 402 | 10.81% | 3,720 |
| Ferry | 467 | 47.17% | 393 | 39.70% | 115 | 11.62% | 11 | 1.11% | 4 | 0.40% | 74 | 7.47% | 990 |
| Franklin | 643 | 52.97% | 485 | 39.95% | 56 | 4.61% | 27 | 2.22% | 3 | 0.25% | 158 | 13.01% | 1,214 |
| Garfield | 556 | 58.53% | 333 | 35.05% | 40 | 4.21% | 13 | 1.37% | 8 | 0.84% | 223 | 23.47% | 950 |
| Island | 450 | 58.21% | 192 | 24.84% | 99 | 12.81% | 28 | 3.62% | 4 | 0.52% | 258 | 33.38% | 773 |
| Jefferson | 859 | 63.16% | 417 | 30.66% | 66 | 4.85% | 11 | 0.81% | 7 | 0.51% | 442 | 32.50% | 1,360 |
| King | 22,297 | 55.75% | 14,644 | 36.62% | 2,173 | 5.43% | 836 | 2.09% | 43 | 0.11% | 7,653 | 19.14% | 39,993 |
| Kitsap | 1,819 | 56.12% | 850 | 26.23% | 494 | 15.24% | 74 | 2.28% | 4 | 0.12% | 969 | 29.90% | 3,241 |
| Kittitas | 1,752 | 56.23% | 985 | 31.61% | 314 | 10.08% | 64 | 2.05% | 1 | 0.03% | 767 | 24.61% | 3,116 |
| Klickitat | 1,245 | 61.12% | 570 | 27.98% | 173 | 8.49% | 46 | 2.26% | 3 | 0.15% | 675 | 33.14% | 2,037 |
| Lewis | 3,170 | 60.45% | 1,412 | 26.93% | 528 | 10.07% | 120 | 2.29% | 14 | 0.27% | 1,758 | 33.52% | 5,244 |
| Lincoln | 2,025 | 55.19% | 1,443 | 39.33% | 124 | 3.38% | 73 | 1.99% | 4 | 0.11% | 582 | 15.86% | 3,669 |
| Mason | 553 | 56.60% | 318 | 32.55% | 80 | 8.19% | 22 | 2.25% | 4 | 0.41% | 235 | 24.05% | 977 |
| Okanogan | 1,368 | 49.23% | 1,074 | 38.65% | 307 | 11.05% | 22 | 0.79% | 8 | 0.29% | 294 | 10.58% | 2,779 |
| Pacific | 1,492 | 69.30% | 483 | 22.43% | 153 | 7.11% | 21 | 0.98% | 4 | 0.19% | 1,009 | 46.86% | 2,153 |
| Pierce | 10,935 | 60.84% | 4,936 | 27.46% | 1,626 | 9.05% | 463 | 2.58% | 14 | 0.08% | 5,999 | 33.38% | 17,974 |
| San Juan | 581 | 65.95% | 178 | 20.20% | 111 | 12.60% | 10 | 1.14% | 1 | 0.11% | 403 | 45.74% | 881 |
| Skagit | 2,924 | 56.42% | 1,449 | 27.96% | 690 | 13.31% | 113 | 2.18% | 7 | 0.14% | 1,475 | 28.46% | 5,183 |
| Skamania | 310 | 60.08% | 143 | 27.71% | 54 | 10.47% | 7 | 1.36% | 2 | 0.39% | 167 | 32.36% | 516 |
| Snohomish | 5,659 | 55.64% | 2,974 | 29.24% | 958 | 9.42% | 567 | 5.57% | 13 | 0.13% | 2,685 | 26.40% | 10,171 |
| Spokane | 11,719 | 58.68% | 6,557 | 32.83% | 1,184 | 5.93% | 496 | 2.48% | 14 | 0.07% | 5,162 | 25.85% | 19,970 |
| Stevens | 2,546 | 52.13% | 1,564 | 32.02% | 646 | 13.23% | 120 | 2.46% | 8 | 0.16% | 982 | 20.11% | 4,884 |
| Thurston | 1,940 | 57.28% | 964 | 28.46% | 367 | 10.84% | 110 | 3.25% | 6 | 0.18% | 976 | 28.82% | 3,387 |
| Wahkiakum | 485 | 70.80% | 150 | 21.90% | 46 | 6.72% | 3 | 0.44% | 1 | 0.15% | 335 | 48.91% | 685 |
| Walla Walla | 2,843 | 60.73% | 1,660 | 35.46% | 102 | 2.18% | 71 | 1.52% | 5 | 0.11% | 1,183 | 25.27% | 4,681 |
| Whatcom | 4,955 | 57.48% | 2,398 | 27.82% | 963 | 11.17% | 296 | 3.43% | 9 | 0.10% | 2,557 | 29.66% | 8,621 |
| Whitman | 3,376 | 52.60% | 2,386 | 37.18% | 337 | 5.25% | 315 | 4.91% | 4 | 0.06% | 990 | 15.43% | 6,418 |
| Yakima | 3,998 | 63.86% | 1,650 | 26.35% | 344 | 5.49% | 258 | 4.12% | 11 | 0.18% | 2,348 | 37.50% | 6,261 |
| Totals | 106,062 | 57.68% | 58,691 | 31.92% | 14,177 | 7.71% | 4,700 | 2.56% | 249 | 0.14% | 43,371 | 25.76% | 183,879 |
See also
editNotes
editReferences
edit- ^ Burnham, Walter Dean; ‘The System of 1896’, in Kleppner, Paul (editor), The Evolution of American Electoral Systems, pp. 176-179 ISBN 0313213798
- ^ Schattschneider, Elmer Eric; The Semisovereign People: A Realist's View of Democracy in America, pp. 76-84 ISBN 0030133661
- ^ Murray, Keith; ‘Issues and Personalities of Pacific Northwest Politics, 1889-1950’, The Pacific Northwest Quarterly, vol. 41, no. 3 (July 1950), pp. 213-233
- ^ Washington Secretary of State. "Presidential Electors". Abstract of Votes Polled in the State of Washington at the General Election held November 3, 1908. Olympia, Washington. pp. 19–21.


