1976 United States presidential election in Michigan
The 1976 United States presidential election in Michigan was held on November 2, 1976, as part of the 1976 United States presidential election.
| ||||||||||||||||||||||||||
All 21 Michigan votes to the Electoral College | ||||||||||||||||||||||||||
|---|---|---|---|---|---|---|---|---|---|---|---|---|---|---|---|---|---|---|---|---|---|---|---|---|---|---|
| Turnout | 59.4% | |||||||||||||||||||||||||
| ||||||||||||||||||||||||||
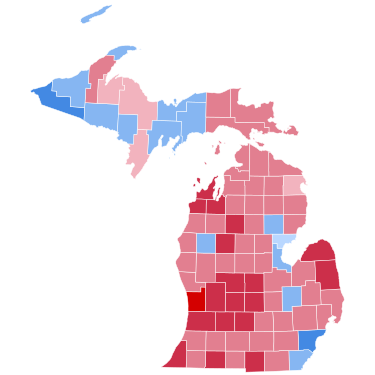
 County results
| ||||||||||||||||||||||||||
| ||||||||||||||||||||||||||
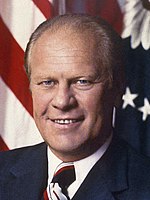
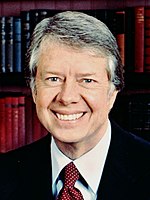
Michigan was won by the incumbent President Gerald Ford, who won his home state with 51.83% of the vote, a victory margin of 5.39 points over Carter, thereby carrying its 21 electoral votes. This result made Michigan about 7.5% more Republican than the nation at large. However, he narrowly lost the general election to Democratic candidate Jimmy Carter. This marked the last time a Democrat won the presidency without carrying Michigan, although Democrats won the popular vote without the state in 2016. Carter also became the first Democrat to win the White House without carrying Macomb County since Woodrow Wilson in 1916. The state would not vote for a losing candidate again until 2000, and for the loser of the popular vote until 2004.
As of the 2024 presidential election, this is the final occasion of only four where Michigan and Pennsylvania voted for different presidential candidates ever since the Democrats and Republicans became the two major parties in U.S. politics.[2][a] This is also the last time that Michigan voted more Republican than Texas, Oklahoma, or Florida; and that the Democratic candidate lost Michigan but won neighboring Ohio. Gogebic County would not vote more Democratic than Wayne County again until 1984.
Primaries
editDemocratic primaries
edit- Jimmy Carter – 43.40%
- Mo Udall – 43.06%
- George Wallace – 6.94%
Republican primaries
edit- Gerald Ford (incumbent) – 64.94%
- Ronald Reagan – 34.25%
Results
edit| Party | Candidate | Votes | % | |
|---|---|---|---|---|
| Republican | Gerald Ford (inc.) | 1,893,742 | 51.83% | |
| Democratic | Jimmy Carter | 1,696,714 | 46.44% | |
| Independent | Eugene McCarthy | 47,905 | 1.31% | |
| Libertarian | Roger MacBride | 5,406 | 0.15% | |
| People's | Margaret Wright | 3,504 | 0.10% | |
| Write-ins | 2,160 | 0.06% | ||
| Socialist Workers | Peter Camejo | 1,804 | 0.05% | |
| U.S. Labor | Lyndon LaRouche | 1,366 | 0.04% | |
| Socialist Labor | Julius Levin | 1,148 | 0.03% | |
| Total votes | 3,653,749 | 100% | ||
Results by county
edit| County | Gerald Ford Republican |
Jimmy Carter Democratic |
Various candidates Other parties |
Margin | Total votes cast[4] | ||||
|---|---|---|---|---|---|---|---|---|---|
| # | % | # | % | # | % | # | % | ||
| Alcona | 2,328 | 52.87% | 2,038 | 46.29% | 37 | 0.84% | 290 | 6.58% | 4,403 |
| Alger | 1,722 | 41.38% | 2,379 | 57.17% | 60 | 1.44% | -657 | -15.79% | 4,161 |
| Allegan | 19,330 | 65.59% | 9,794 | 33.23% | 347 | 1.18% | 9,536 | 32.36% | 29,471 |
| Alpena | 6,380 | 49.59% | 6,310 | 49.04% | 176 | 1.37% | 70 | 0.55% | 12,866 |
| Antrim | 4,369 | 58.11% | 3,032 | 40.33% | 117 | 1.56% | 1,337 | 17.78% | 7,518 |
| Arenac | 2,687 | 49.55% | 2,695 | 49.70% | 41 | 0.76% | -8 | -0.15% | 5,423 |
| Baraga | 1,788 | 49.47% | 1,778 | 49.20% | 48 | 1.33% | 10 | 0.27% | 3,614 |
| Barry | 11,178 | 60.79% | 6,967 | 37.89% | 243 | 1.32% | 4,211 | 22.90% | 18,388 |
| Bay | 23,174 | 46.64% | 25,958 | 52.24% | 557 | 1.12% | -2,784 | -5.60% | 49,689 |
| Benzie | 3,085 | 61.23% | 1,891 | 37.53% | 62 | 1.23% | 1,194 | 23.70% | 5,038 |
| Berrien | 40,835 | 61.13% | 25,163 | 37.67% | 800 | 1.20% | 15,672 | 23.46% | 66,798 |
| Branch | 8,251 | 55.74% | 6,301 | 42.57% | 250 | 1.69% | 1,950 | 13.17% | 14,802 |
| Calhoun | 30,390 | 53.77% | 25,229 | 44.64% | 901 | 1.59% | 5,161 | 9.13% | 56,520 |
| Cass | 9,893 | 55.15% | 7,843 | 43.72% | 203 | 1.13% | 2,050 | 11.43% | 17,939 |
| Charlevoix | 5,145 | 55.57% | 3,953 | 42.70% | 160 | 1.73% | 1,192 | 12.87% | 9,258 |
| Cheboygan | 4,894 | 55.13% | 3,880 | 43.70% | 104 | 1.17% | 1,014 | 11.43% | 8,878 |
| Chippewa | 7,025 | 53.32% | 6,022 | 45.71% | 128 | 0.97% | 1,003 | 7.61% | 13,175 |
| Clare | 4,879 | 53.46% | 4,153 | 45.51% | 94 | 1.03% | 726 | 7.95% | 9,126 |
| Clinton | 13,475 | 63.11% | 7,549 | 35.35% | 329 | 1.54% | 5,926 | 27.76% | 21,353 |
| Crawford | 2,359 | 54.82% | 1,889 | 43.90% | 55 | 1.28% | 470 | 10.92% | 4,303 |
| Delta | 7,809 | 45.85% | 9,027 | 53.00% | 197 | 1.16% | -1,218 | -7.15% | 17,033 |
| Dickinson | 5,922 | 48.63% | 6,134 | 50.37% | 121 | 0.99% | -212 | -1.74% | 12,177 |
| Eaton | 22,120 | 63.65% | 12,083 | 34.77% | 547 | 1.57% | 10,037 | 28.88% | 34,750 |
| Emmet | 5,910 | 58.49% | 4,013 | 39.72% | 181 | 1.79% | 1,897 | 18.77% | 10,104 |
| Genesee | 80,004 | 46.67% | 88,967 | 51.89% | 2,467 | 1.44% | -8,963 | -5.22% | 171,438 |
| Gladwin | 3,794 | 50.14% | 3,719 | 49.15% | 54 | 0.71% | 75 | 0.99% | 7,567 |
| Gogebic | 3,953 | 38.04% | 6,341 | 61.02% | 98 | 0.94% | -2,388 | -22.98% | 10,392 |
| Grand Traverse | 13,505 | 63.85% | 7,263 | 34.34% | 382 | 1.81% | 6,242 | 29.51% | 21,150 |
| Gratiot | 9,526 | 63.01% | 5,429 | 35.91% | 163 | 1.08% | 4,097 | 27.10% | 15,118 |
| Hillsdale | 9,307 | 62.23% | 5,427 | 36.29% | 221 | 1.48% | 3,880 | 25.94% | 14,955 |
| Houghton | 8,049 | 51.60% | 7,352 | 47.13% | 199 | 1.28% | 697 | 4.47% | 15,600 |
| Huron | 9,297 | 61.26% | 5,721 | 37.70% | 158 | 1.04% | 3,576 | 23.56% | 15,176 |
| Ingham | 66,729 | 55.92% | 47,890 | 40.13% | 4,708 | 3.95% | 18,839 | 15.79% | 119,327 |
| Ionia | 11,737 | 62.46% | 6,820 | 36.29% | 234 | 1.25% | 4,917 | 26.17% | 18,791 |
| Iosco | 5,500 | 52.39% | 4,875 | 46.44% | 123 | 1.17% | 625 | 5.95% | 10,498 |
| Iron | 3,224 | 41.77% | 4,401 | 57.02% | 93 | 1.20% | -1,177 | -15.25% | 7,718 |
| Isabella | 10,577 | 57.66% | 7,281 | 39.69% | 487 | 2.65% | 3,296 | 17.97% | 18,345 |
| Jackson | 32,873 | 56.23% | 24,726 | 42.30% | 858 | 1.47% | 8,147 | 13.93% | 58,457 |
| Kalamazoo | 51,462 | 59.09% | 33,411 | 38.37% | 2,212 | 2.54% | 18,051 | 20.72% | 87,085 |
| Kalkaska | 2,280 | 53.13% | 1,957 | 45.61% | 54 | 1.26% | 323 | 7.52% | 4,291 |
| Kent | 126,805 | 67.22% | 59,000 | 31.28% | 2,828 | 1.50% | 67,805 | 35.94% | 188,633 |
| Keweenaw | 606 | 47.68% | 658 | 51.77% | 7 | 0.55% | -52 | -4.09% | 1,271 |
| Lake | 1,598 | 41.96% | 2,179 | 57.22% | 31 | 0.81% | -581 | -15.26% | 3,808 |
| Lapeer | 12,349 | 55.59% | 9,503 | 42.78% | 363 | 1.63% | 2,846 | 12.81% | 22,215 |
| Leelanau | 4,240 | 62.33% | 2,437 | 35.82% | 126 | 1.85% | 1,803 | 26.51% | 6,803 |
| Lenawee | 18,397 | 55.02% | 14,610 | 43.70% | 428 | 1.28% | 3,787 | 11.32% | 33,435 |
| Livingston | 19,437 | 59.83% | 12,415 | 38.22% | 634 | 1.95% | 7,022 | 21.61% | 32,486 |
| Luce | 1,379 | 55.27% | 1,099 | 44.05% | 17 | 0.68% | 280 | 11.22% | 2,495 |
| Mackinac | 3,107 | 55.22% | 2,452 | 43.58% | 68 | 1.21% | 655 | 11.64% | 5,627 |
| Macomb | 132,499 | 51.24% | 121,176 | 46.86% | 4,928 | 1.91% | 11,323 | 4.38% | 258,603 |
| Manistee | 5,532 | 54.59% | 4,479 | 44.20% | 123 | 1.21% | 1,053 | 10.39% | 10,134 |
| Marquette | 12,984 | 49.34% | 12,837 | 48.78% | 494 | 1.88% | 147 | 0.56% | 26,315 |
| Mason | 6,812 | 59.15% | 4,541 | 39.43% | 163 | 1.42% | 2,271 | 19.72% | 11,516 |
| Mecosta | 7,287 | 59.63% | 4,725 | 38.66% | 209 | 1.71% | 2,562 | 20.97% | 12,221 |
| Menominee | 5,633 | 49.60% | 5,596 | 49.27% | 128 | 1.13% | 37 | 0.33% | 11,357 |
| Midland | 17,631 | 58.57% | 11,959 | 39.73% | 511 | 1.70% | 5,672 | 18.84% | 30,101 |
| Missaukee | 2,943 | 62.87% | 1,688 | 36.06% | 50 | 1.07% | 1,255 | 26.81% | 4,681 |
| Monroe | 20,676 | 46.36% | 23,290 | 52.22% | 631 | 1.41% | -2,614 | -5.86% | 44,597 |
| Montcalm | 10,439 | 60.36% | 6,684 | 38.65% | 171 | 0.99% | 3,755 | 21.71% | 17,294 |
| Montmorency | 1,882 | 52.03% | 1,684 | 46.56% | 51 | 1.41% | 198 | 5.47% | 3,617 |
| Muskegon | 35,548 | 56.06% | 27,013 | 42.60% | 846 | 1.33% | 8,535 | 13.46% | 63,407 |
| Newaygo | 8,258 | 58.78% | 5,622 | 40.01% | 170 | 1.21% | 2,636 | 18.77% | 14,050 |
| Oakland | 244,271 | 58.69% | 164,266 | 39.47% | 7,668 | 1.84% | 80,005 | 19.22% | 416,205 |
| Oceana | 5,236 | 59.51% | 3,427 | 38.95% | 135 | 1.53% | 1,809 | 20.56% | 8,798 |
| Ogemaw | 3,212 | 47.07% | 3,545 | 51.95% | 67 | 0.98% | -333 | -4.88% | 6,824 |
| Ontonagon | 2,462 | 43.91% | 3,104 | 55.36% | 41 | 0.73% | -642 | -11.45% | 5,607 |
| Osceola | 4,467 | 62.23% | 2,603 | 36.26% | 108 | 1.50% | 1,864 | 25.97% | 7,178 |
| Oscoda | 1,541 | 57.56% | 1,108 | 41.39% | 28 | 1.05% | 433 | 16.17% | 2,677 |
| Otsego | 3,155 | 53.01% | 2,724 | 45.77% | 73 | 1.23% | 431 | 7.24% | 5,952 |
| Ottawa | 49,196 | 74.12% | 16,381 | 24.68% | 793 | 1.19% | 32,815 | 49.44% | 66,370 |
| Presque Isle | 3,545 | 51.02% | 3,334 | 47.99% | 69 | 0.99% | 211 | 3.03% | 6,948 |
| Roscommon | 4,608 | 54.85% | 3,691 | 43.94% | 102 | 1.21% | 917 | 10.91% | 8,401 |
| Saginaw | 46,765 | 55.63% | 36,280 | 43.15% | 1,026 | 1.22% | 10,485 | 12.48% | 84,071 |
| Sanilac | 10,597 | 62.87% | 6,042 | 35.84% | 217 | 1.29% | 4,555 | 27.03% | 16,856 |
| Schoolcraft | 1,933 | 46.53% | 2,158 | 51.95% | 63 | 1.52% | -225 | -5.42% | 4,154 |
| Shiawassee | 15,113 | 54.52% | 12,202 | 44.02% | 406 | 1.46% | 2,911 | 10.50% | 27,721 |
| St. Clair | 26,311 | 52.74% | 22,734 | 45.57% | 844 | 1.69% | 3,577 | 7.17% | 49,889 |
| St. Joseph | 11,784 | 61.07% | 7,306 | 37.86% | 205 | 1.06% | 4,478 | 23.21% | 19,295 |
| Tuscola | 12,059 | 59.86% | 7,932 | 39.38% | 153 | 0.76% | 4,127 | 20.48% | 20,144 |
| Van Buren | 13,615 | 56.02% | 10,366 | 42.65% | 321 | 1.32% | 3,249 | 13.37% | 24,302 |
| Washtenaw | 56,807 | 50.86% | 50,917 | 45.59% | 3,965 | 3.55% | 5,890 | 5.27% | 111,689 |
| Wayne | 348,588 | 38.18% | 548,767 | 60.11% | 15,635 | 1.71% | -200,179 | -21.93% | 912,990 |
| Wexford | 5,670 | 54.96% | 4,519 | 43.80% | 128 | 1.24% | 1,151 | 11.16% | 10,317 |
| Totals | 1,893,742 | 51.83% | 1,696,714 | 46.44% | 63,293 | 1.73% | 197,028 | 5.39% | 3,653,749 |
Counties that flipped from Republican to Democratic
editCounties that flipped from Democratic to Republican
editSee also
editNotes
editReferences
edit- ^ "SOS - General Election Voter Registration/Turnout Statistics".
- ^ Brownstein, Ronald (September 16, 2024). "Why these three states are the most consistent tipping point in American politics". CNN. Retrieved September 16, 2024.
- ^ "1976 Presidential General Election Results - Michigan". Retrieved April 4, 2018.
- ^ Our Campaigns; MI US President 1976

