Climate_Change_Attribution_German.png (500 × 573 pixels, file size: 32 KB, MIME type: image/png)
File history
Click on a date/time to view the file as it appeared at that time.
| Date/Time | Thumbnail | Dimensions | User | Comment | |
|---|---|---|---|---|---|
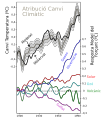
| current | 21:06, 12 October 2006 |  | 500 × 573 (32 KB) | Xavax | ==Translation== This is the German translation of the original English image, created by Xavax. == Description == [[Image:Instrumental Temperature Record.png|thumb|right|250px|Instrumental temperature record of the last 150 years. This |
| 11:41, 12 October 2006 |  | 500 × 573 (32 KB) | Xavax | ==Translation== This is the German translation of the original English image, created by Xavax. == Description == [[Image:Instrumental Temperature Record.png|thumb|right|250px|Instrumental temperature record of the last 150 years. This | |
| 11:07, 12 October 2006 |  | 500 × 573 (32 KB) | Xavax | ==Translation== This is the German translation of the original English image, created by Xavax. == Description == [[Image:Instrumental Temperature Record.png|thumb|right|250px|Instrumental temperature record of the last 150 years. This | |
| 11:05, 12 October 2006 |  | 500 × 573 (32 KB) | Xavax | ==Translation== This is the German translation of the original English image, created by Xavax. == Description == [[Image:Instrumental Temperature Record.png|thumb|right|250px|Instrumental temperature record of the last 150 years. This | |
| 19:44, 8 October 2006 |  | 500 × 573 (32 KB) | Xavax | == Description == thumb|right|250px|Instrumental temperature record of the last 150 years. This data is the same as the black curve in the figure. This figure, based on Meehl et al. (2004), shows the ability | |
| 19:28, 8 October 2006 |  | 500 × 573 (32 KB) | Xavax | == Description == thumb|right|250px|Instrumental temperature record of the last 150 years. This data is the same as the black curve in the figure. This figure, based on Meehl et al. (2004), shows the ability |
File usage
The following page uses this file:
Global file usage
The following other wikis use this file:
- Usage on als.wiki.x.io
- Usage on de.wiki.x.io
- Kontroverse um die globale Erwärmung
- Wikipedia:Fotowerkstatt/Archiv/2006/Oktober
- Globale Abkühlung
- Benutzer:Nils Simon/Kontroverse um die globale Erwärmung
- Benutzer Diskussion:Jbo166/Archiv/2009
- Wikipedia Diskussion:Vermittlungsausschuss/Problem zwischen Jbo166/Hg6996 und Polentario
- Diskussion:Tim Patterson/Archiv/2008
- Diskussion:Kosmische Strahlung/Archiv/1
- Diskussion:Globale Erwärmung/Archiv/003
- Benutzer:Zumthie/Fundstücke
- Diskussion:Globale Erwärmung/Archiv/010
- Diskussion:Globale Erwärmung/Archiv/011
- Benutzer Diskussion:Konrad Conrad/Archiv/2015
- Usage on es.wiki.x.io
- Usage on rm.wiki.x.io


