This article needs additional citations for verification. (September 2022) |
Federal elections were held in West Germany on 3 October 1976 to elect the members of the 8th Bundestag. Although the CDU/CSU alliance became the largest faction in parliament, Helmut Schmidt of the Social Democratic Party remained Chancellor.
| |||||||||||||||||||||||||||||||||||||||||
All 496 seats in the Bundestag[a] 249 seats needed for a majority | |||||||||||||||||||||||||||||||||||||||||
|---|---|---|---|---|---|---|---|---|---|---|---|---|---|---|---|---|---|---|---|---|---|---|---|---|---|---|---|---|---|---|---|---|---|---|---|---|---|---|---|---|---|
| Registered | 42,058,015 ( | ||||||||||||||||||||||||||||||||||||||||
| Turnout | 90.7% ( | ||||||||||||||||||||||||||||||||||||||||
| |||||||||||||||||||||||||||||||||||||||||
 Results by constituency for the first votes. Grey denotes seats won by the CDU/CSU; red denotes seats won by the SPD. | |||||||||||||||||||||||||||||||||||||||||
| |||||||||||||||||||||||||||||||||||||||||
Campaign
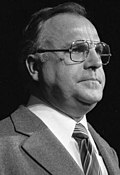
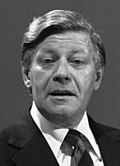
editThe coalition of the SPD and the FDP wanted to be re-elected, with the SPD, since 1974 led by Helmut Schmidt, the party's candidate for Chancellor. The CDU and the CSU tried to achieve an absolute majority of the votes to make CDU chairman Helmut Kohl Chancellor, but they fell six seats short of their target.
Opinion polls
edit| Polling firm | Fieldwork date | Sample size |
Union | SPD | FDP | Others | Abstention | Lead |
|---|---|---|---|---|---|---|---|---|
| 1976 federal election | 3 Oct 1976 | – | 48.6 | 42.6 | 7.9 | 0.9 | 9.3 | 6.1 |
| Emnid for SPIEGEL | Sep 1976 | N/A | 49 | 41 | 8 | 2 | — | 8 |
| Emnid for SPIEGEL | Aug 1976 | N/A | 48 | 43 | 7 | 2 | — | 5 |
| Emnid for SPIEGEL | Jul 1976 | N/A | 47 | 44 | 8 | 1 | — | 3 |
| Emnid for SPIEGEL | Jun 1976 | N/A | 51 | 41 | 8 | 0 | — | 10 |
| Allensbach | Nov/Dec 1975 | N/A | 50.7 | 39.7 | 8.6 | 1.0 | — | 10.0 |
| Infratest | Nov/Dec 1975 | N/A | 47 | 40 | 11 | 2 | — | 7 |
| Emnid | Nov/Dec 1975 | N/A | 45 | 43 | 10 | 2 | — | 2 |
| 1972 federal election | 19 Nov 1972 | – | 44.9 | 45.8 | 8.4 | 0.6 | 8.9 | 0.9 |
Results
edit| Party | Party-list | Constituency | Seats | |||||||||
|---|---|---|---|---|---|---|---|---|---|---|---|---|
| Votes | % | Seats | Votes | % | Seats | Elected | West Berlin | Total | +/– | |||
| Social Democratic Party | 16,099,019 | 42.56 | 100 | 16,471,321 | 43.70 | 114 | 214 | 10 | 224 | –18 | ||
| Christian Democratic Union | 14,367,302 | 37.99 | 96 | 14,423,157 | 38.26 | 94 | 190 | 11 | 201 | +15 | ||
| Christian Social Union | 4,027,499 | 10.65 | 13 | 4,008,514 | 10.63 | 40 | 53 | 0 | 53 | +5 | ||
| Free Democratic Party | 2,995,085 | 7.92 | 39 | 2,417,683 | 6.41 | 0 | 39 | 1 | 40 | –2 | ||
| National Democratic Party | 122,661 | 0.32 | 0 | 136,028 | 0.36 | 0 | 0 | 0 | 0 | 0 | ||
| German Communist Party | 118,581 | 0.31 | 0 | 170,855 | 0.45 | 0 | 0 | 0 | 0 | 0 | ||
| Communist Party of Germany | 22,714 | 0.06 | 0 | 8,822 | 0.02 | 0 | 0 | 0 | 0 | New | ||
| Action Community of Independent Germans | 22,202 | 0.06 | 0 | 19,490 | 0.05 | 0 | 0 | 0 | 0 | New | ||
| Communist League of West Germany | 20,018 | 0.05 | 0 | 21,414 | 0.06 | 0 | 0 | 0 | 0 | New | ||
| European Workers' Party | 6,811 | 0.02 | 0 | 3,177 | 0.01 | 0 | 0 | 0 | 0 | New | ||
| Christian Bavarian People's Party | 6,720 | 0.02 | 0 | 4,876 | 0.01 | 0 | 0 | 0 | 0 | New | ||
| International Marxist Group | 4,759 | 0.01 | 0 | 2,037 | 0.01 | 0 | 0 | 0 | 0 | New | ||
| Action Community Fourth Party | 4,723 | 0.01 | 0 | 2,636 | 0.01 | 0 | 0 | 0 | 0 | New | ||
| 5%-Block | 2,940 | 0.01 | 0 | 985 | 0.00 | 0 | 0 | 0 | 0 | New | ||
| Independent Workers' Party | 765 | 0.00 | 0 | 499 | 0.00 | 0 | 0 | 0 | 0 | New | ||
| United Left | 701 | 0.00 | 0 | 217 | 0.00 | 0 | 0 | 0 | 0 | New | ||
| Right and Freedom Party | 227 | 0.00 | 0 | 0 | 0 | 0 | New | |||||
| Independents and voter groups | 3,706 | 0.01 | 0 | 0 | 0 | 0 | 0 | |||||
| Total | 37,822,500 | 100.00 | 248 | 37,695,644 | 100.00 | 248 | 496 | 22 | 518 | 0 | ||
| Valid votes | 37,822,500 | 99.10 | 37,695,644 | 98.77 | ||||||||
| Invalid/blank votes | 343,253 | 0.90 | 470,109 | 1.23 | ||||||||
| Total votes | 38,165,753 | 100.00 | 38,165,753 | 100.00 | ||||||||
| Registered voters/turnout | 42,058,015 | 90.75 | 42,058,015 | 90.75 | ||||||||
| Source: Bundeswahlleiter | ||||||||||||
Results by state
editConstituency seats
edit| State | Total seats |
Seats won | ||
|---|---|---|---|---|
| SPD | CDU | CSU | ||
| Baden-Württemberg | 36 | 4 | 32 | |
| Bavaria | 44 | 4 | 40 | |
| Bremen | 3 | 3 | ||
| Hamburg | 8 | 8 | ||
| Hesse | 22 | 17 | 5 | |
| Lower Saxony | 30 | 18 | 12 | |
| North Rhine-Westphalia | 73 | 45 | 28 | |
| Rhineland-Palatinate | 16 | 6 | 10 | |
| Saarland | 5 | 3 | 2 | |
| Schleswig-Holstein | 11 | 6 | 5 | |
| Total | 248 | 114 | 94 | 40 |
List seats
edit| State | Total seats |
Seats won | |||
|---|---|---|---|---|---|
| SPD | CDU | FDP | CSU | ||
| Baden-Württemberg | 35 | 22 | 6 | 7 | |
| Bavaria | 44 | 25 | 6 | 13 | |
| Bremen | 2 | 2 | |||
| Hamburg | 6 | 5 | 1 | ||
| Hesse | 25 | 5 | 16 | 4 | |
| Lower Saxony | 32 | 11 | 16 | 5 | |
| North Rhine-Westphalia | 75 | 25 | 38 | 12 | |
| Rhineland-Palatinate | 15 | 7 | 6 | 2 | |
| Saarland | 3 | 1 | 2 | ||
| Schleswig-Holstein | 11 | 4 | 5 | 2 | |
| Total | 248 | 100 | 96 | 39 | 13 |
Aftermath
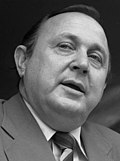
editThe coalition between the SPD and the FDP remained in government, with Helmut Schmidt as Chancellor. Between the "sister parties" of CDU and Bavarian CSU there emerged a critical conflict, as the CSU leader Franz Josef Strauß wanted to break both the united Bundestag group of the parties and the agreement not to compete against each other in any Land. Later, this attack was withdrawn, while Strauß became candidate for chancellor for the 1980 elections.
Notes
edit- ^ As well as the 22 non-voting delegates representing West Berlin, elected by the West Berlin Legislature.
- ^ As well as 11 non-voting delegates for West Berlin.
- ^ As well as 10 non-voting delegates for West Berlin.
- ^ As well as 1 non-voting delegate for West Berlin.


