Federal elections were held in West Germany on 5 October 1980 to elect the members of the 9th Bundestag. Although the CDU/CSU remained the largest faction in parliament, Helmut Schmidt of the Social Democratic Party remained Chancellor.
| |||||||||||||||||||||||||||||||||||||||||
All 497 seats in the Bundestag[a] 249 seats needed for a majority | |||||||||||||||||||||||||||||||||||||||||
|---|---|---|---|---|---|---|---|---|---|---|---|---|---|---|---|---|---|---|---|---|---|---|---|---|---|---|---|---|---|---|---|---|---|---|---|---|---|---|---|---|---|
| Registered | 43,231,741 | ||||||||||||||||||||||||||||||||||||||||
| Turnout | 38,292,176 (88.6%) | ||||||||||||||||||||||||||||||||||||||||
| |||||||||||||||||||||||||||||||||||||||||
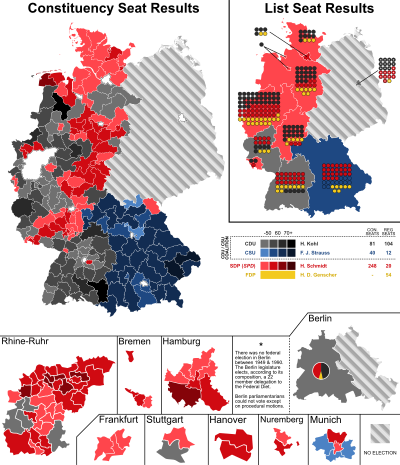
 The left side shows the winning party vote in the constituencies, the right side shows the seats won by parties in each of the states. The pie chart over West Berlin shows the partisan composition of its legislature. | |||||||||||||||||||||||||||||||||||||||||
| |||||||||||||||||||||||||||||||||||||||||
Issues and campaign
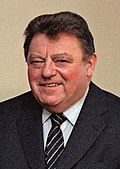
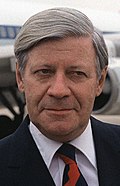
Chancellor Helmut Schmidt of the SPD-FDP coalition wanted to be re-elected. The CDU/CSU tried to make their candidate the elected Chancellor, CSU leader Franz Josef Strauß. It was the first time that their candidate was from the CSU. Strauß, immensely popular in Bavaria, found it difficult to appeal to people in other parts of Germany. One important reason for Strauss's unpopularity compared to Federal Chancellor Helmut Schmidt, was his tendency to talk sharply and militantly about his political opponents. Schmidt, by contrast, was still seen by many West German voters as a moderate and practical manager and doer, who focused on getting concrete political and economic results more than on political rhetoric.[1][2][3]
Results
| Party | Party-list | Constituency | Seats | |||||||||
|---|---|---|---|---|---|---|---|---|---|---|---|---|
| Votes | % | Seats | Votes | % | Seats | Elected | West Berlin | Total | +/– | |||
| Social Democratic Party | 16,260,677 | 42.86 | 91 | 16,808,861 | 44.46 | 127 | 218 | 10 | 228 | +4 | ||
| Christian Democratic Union | 12,989,200 | 34.24 | 93 | 13,467,207 | 35.62 | 81 | 174 | 11 | 185 | –16 | ||
| Free Democratic Party | 4,030,999 | 10.62 | 53 | 2,720,480 | 7.20 | 0 | 53 | 1 | 54 | +14 | ||
| Christian Social Union | 3,908,459 | 10.30 | 12 | 3,941,365 | 10.43 | 40 | 52 | 0 | 52 | –1 | ||
| The Greens | 569,589 | 1.50 | 0 | 732,619 | 1.94 | 0 | 0 | 0 | 0 | New | ||
| German Communist Party | 71,600 | 0.19 | 0 | 107,158 | 0.28 | 0 | 0 | 0 | 0 | 0 | ||
| National Democratic Party | 68,096 | 0.18 | 0 | 0 | 0 | 0 | 0 | |||||
| Citizens' Party | 11,256 | 0.03 | 0 | 507 | 0.00 | 0 | 0 | 0 | 0 | New | ||
| People's Front Against Reaction, Fascism and War | 9,319 | 0.02 | 0 | 7,160 | 0.02 | 0 | 0 | 0 | 0 | New | ||
| Communist League of West Germany | 8,174 | 0.02 | 0 | 12,008 | 0.03 | 0 | 0 | 0 | 0 | 0 | ||
| European Workers' Party | 7,666 | 0.02 | 0 | 4,992 | 0.01 | 0 | 0 | 0 | 0 | 0 | ||
| Christian Bavarian People's Party | 3,946 | 0.01 | 0 | 0 | 0 | 0 | 0 | |||||
| German Union | 421 | 0.00 | 0 | 0 | 0 | 0 | New | |||||
| Independent Workers' Party | 159 | 0.00 | 0 | 0 | 0 | 0 | 0 | |||||
| German Freedom Party | 96 | 0.00 | 0 | 0 | 0 | 0 | New | |||||
| Independents and voter groups | 3,498 | 0.01 | 0 | 0 | 0 | 0 | 0 | |||||
| Total | 37,938,981 | 100.00 | 249 | 37,806,531 | 100.00 | 248 | 497 | 22 | 519 | +1 | ||
| Valid votes | 37,938,981 | 99.08 | 37,806,531 | 98.73 | ||||||||
| Invalid/blank votes | 353,115 | 0.92 | 485,645 | 1.27 | ||||||||
| Total votes | 38,292,096 | 100.00 | 38,292,176 | 100.00 | ||||||||
| Registered voters/turnout | 43,231,741 | 88.57 | 43,231,741 | 88.57 | ||||||||
| Source: Bundeswahlleiter | ||||||||||||
Results by state
Constituency seats
| State | Total seats |
Seats won | ||
|---|---|---|---|---|
| SPD | CDU | CSU | ||
| Baden-Württemberg | 37 | 6 | 31 | |
| Bavaria | 45 | 5 | 40 | |
| Bremen | 3 | 3 | ||
| Hamburg | 7 | 7 | ||
| Hesse | 22 | 19 | 3 | |
| Lower Saxony | 31 | 23 | 8 | |
| North Rhine-Westphalia | 71 | 44 | 27 | |
| Rhineland-Palatinate | 16 | 6 | 10 | |
| Saarland | 5 | 3 | 2 | |
| Schleswig-Holstein | 11 | 11 | ||
| Total | 248 | 127 | 81 | 40 |
List seats
| State | Total seats |
Seats won | |||
|---|---|---|---|---|---|
| CDU | SPD | FDP | CSU | ||
| Baden-Württemberg | 35 | 5 | 21 | 9 | |
| Bavaria | 44 | 25 | 7 | 12 | |
| Bremen | 1 | 1 | |||
| Hamburg | 6 | 4 | 2 | ||
| Hesse | 24 | 16 | 3 | 5 | |
| Lower Saxony | 32 | 18 | 7 | 7 | |
| North Rhine-Westphalia | 76 | 33 | 26 | 17 | |
| Rhineland-Palatinate | 16 | 5 | 8 | 3 | |
| Saarland | 3 | 2 | 1 | ||
| Schleswig-Holstein | 12 | 9 | 3 | ||
| Total | 249 | 93 | 91 | 53 | 12 |
Post-election
The coalition between the SPD and the FDP returned to government, with Helmut Schmidt as Chancellor. In 1982, the FDP quit the government, which led to the government's collapse and replacement with a new CDU/CSU – FDP coalition under Helmut Kohl.
Notes
- ^ As well as the 22 non-voting delegates for West Berlin, elected by the West Berlin Legislature.
- ^ As well as 11 non-voting delegates for West Berlin.
- ^ As well as 10 non-voting delegates for West Berlin.
- ^ As well as 1 non-voting delegate for West Berlin.
References
- ^ Bjøl, Erling (1984). Grimberg, Carl (ed.). History of the Nations. Vol. 22: From Peace to the Cold War. Helsinki: WSOY. pp. 495, 497–499.
- ^ Bjøl, Erling (1984). Grimberg, Carl (ed.). History of the Nations. Vol. 23: The Rich West. Helsinki: WSOY. pp. 353–356.
- ^ Bark, Dennis L.; Gress, David (1989). ""The Era of Macher [Doer]"". A history of West Germany. Vol. 2: Democracy and Its Discontents, 1963–1988. Oxford, UK: Blackwell. ISBN 0-631-16787-0. OCLC 18907067.


