1988 United States presidential election in New Jersey
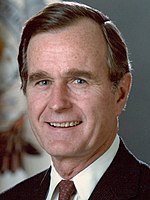
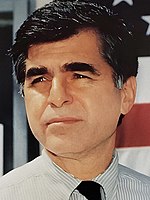
The 1988 United States presidential election in New Jersey took place on November 8, 1988. All 50 states and the District of Columbia, were part of the 1988 United States presidential election. Voters chose 16 electors to the Electoral College, which selected the president and vice president. New Jersey was won by incumbent Republican Vice President George H. W. Bush of Texas, who was running against Democratic Massachusetts Governor Michael Dukakis. Bush ran with Indiana Senator Dan Quayle while Dukakis ran with Texas Senator Lloyd Bentsen.
| ||||||||||||||||||||||||||
| ||||||||||||||||||||||||||
| ||||||||||||||||||||||||||
| ||||||||||||||||||||||||||
Bush carried New Jersey with 56.24% of the vote, while Dukakis received 42.60% a 13.64% margin of victory.[1] New Jersey weighed in for this election as almost 6% points more Republican than the national average. Bush won 18 of New Jersey's 21 counties, with Dukakis only winning the heavily Democratic counties of Mercer, Essex, and Hudson.
As of the 2024 presidential election, this is the last time that New Jersey would vote Republican in a presidential election, as well as the last time that the Republican nominee has carried the following counties: Burlington, Camden, Middlesex, and Union.[2] All of these counties would become reliably Democratic in every election that has followed, as northern suburban voters shifted away from the GOP in the 1990s. Gloucester would not vote Republican again until 2016. Atlantic and Cumberland counties would not vote Republican again until 2024. Bush won the election in New Jersey with a strong 13.6-point margin.
Results
edit| 1988 United States presidential election in New Jersey[3] | |||||
|---|---|---|---|---|---|
| Party | Candidate | Votes | Percentage | Electoral votes | |
| Republican | George H. W. Bush | 1,743,192 | 56.24% | 16 | |
| Democratic | Michael Dukakis | 1,320,352 | 42.60% | 0 | |
| Peace and Freedom Party | Herbert Lewin | 9,953 | 0.32% | 0 | |
| Libertarian | Ron Paul | 8,421 | 0.27% | 0 | |
| New Alliance Party | Lenora Fulani | 5,139 | 0.17% | 0 | |
| Progressive | Eugene McCarthy | 3,454 | 0.11% | 0 | |
| Socialist | Willa Kenoyer | 2,587 | 0.08% | 0 | |
| America First | David Duke | 2,446 | 0.08% | 0 | |
| Socialist Workers Party | James Warren | 2,298 | 0.07% | 0 | |
| Workers World | Larry Holmes | 1,020 | 0.03% | 0 | |
| Socialist Equality Party | Edward Winn | 691 | 0.02% | 0 | |
| Totals | 3,099,553 | 100.0% | 16 | ||
| Voter Turnout (Voting age/Registered) | 52%/77% | ||||
Results by county
edit| County | George H.W. Bush Republican |
Michael Dukakis Democratic |
Various candidates Other parties |
Margin | Total votes cast | ||||
|---|---|---|---|---|---|---|---|---|---|
| # | % | # | % | # | % | # | % | ||
| Atlantic | 44,748 | 56.33% | 34,047 | 42.86% | 647 | 0.81% | 10,701 | 13.47% | 79,442 |
| Bergen | 226,885 | 58.19% | 160,655 | 41.20% | 2,393 | 0.61% | 66,230 | 16.99% | 389,933 |
| Burlington | 87,416 | 58.30% | 61,140 | 40.77% | 1,393 | 0.93% | 26,276 | 17.53% | 149,949 |
| Camden | 100,072 | 51.98% | 90,704 | 47.12% | 1,739 | 0.90% | 9,368 | 4.86% | 192,515 |
| Cape May | 28,738 | 65.14% | 15,105 | 34.24% | 274 | 0.62% | 13,633 | 30.90% | 44,117 |
| Cumberland | 26,024 | 53.83% | 21,869 | 45.23% | 456 | 0.94% | 4,155 | 8.60% | 48,349 |
| Essex | 111,491 | 40.25% | 156,098 | 56.36% | 9,378 | 3.39% | -44,607 | -16.11% | 276,967 |
| Gloucester | 51,708 | 58.68% | 35,479 | 40.26% | 930 | 1.06% | 16,229 | 18.42% | 88,117 |
| Hudson | 84,334 | 45.72% | 98,507 | 53.40% | 1,622 | 0.88% | -14,173 | -7.68% | 184,463 |
| Hunterdon | 31,907 | 69.09% | 13,758 | 29.79% | 517 | 1.12% | 18,149 | 39.30% | 46,182 |
| Mercer | 65,384 | 48.31% | 68,712 | 50.77% | 1,249 | 0.92% | -3,328 | -2.46% | 135,345 |
| Middlesex | 143,422 | 54.30% | 117,149 | 44.35% | 3,548 | 1.34% | 26,273 | 9.95% | 264,119 |
| Monmouth | 147,320 | 61.14% | 91,844 | 38.12% | 1,793 | 0.74% | 55,476 | 23.02% | 240,957 |
| Morris | 127,420 | 68.05% | 58,721 | 31.36% | 1,108 | 0.59% | 68,699 | 36.69% | 187,249 |
| Ocean | 124,587 | 65.38% | 64,474 | 33.83% | 1,497 | 0.79% | 60,113 | 31.55% | 190,558 |
| Passaic | 88,070 | 55.91% | 66,254 | 42.06% | 3,189 | 2.02% | 21,816 | 13.85% | 157,513 |
| Salem | 15,240 | 59.52% | 9,956 | 38.88% | 410 | 1.60% | 5,284 | 20.64% | 25,606 |
| Somerset | 67,658 | 63.71% | 37,406 | 35.22% | 1,129 | 1.06% | 30,252 | 28.49% | 106,193 |
| Sussex | 36,086 | 71.94% | 13,676 | 27.26% | 398 | 0.79% | 22,410 | 44.68% | 50,160 |
| Union | 112,967 | 54.27% | 93,158 | 44.75% | 2,028 | 0.97% | 19,809 | 9.52% | 208,153 |
| Warren | 21,715 | 64.50% | 11,640 | 34.57% | 311 | 0.92% | 10,075 | 29.93% | 33,666 |
| Totals | 1,743,192 | 56.24% | 1,320,352 | 42.60% | 36,009 | 1.16% | 422,840 | 13.64% | 3,099,553 |
Counties that flipped from Republican to Democratic
editBy congressional district
editBush won 12 of 14 congressional districts, including six that elected Democrats.[4]
| District | Dukakis | Bush | Representative |
|---|---|---|---|
| 1st | 47.5% | 52.5% | James Florio |
| 2nd | 41.2% | 58.8% | William J. Hughes |
| 3rd | 37.5% | 62.5% | James J. Howard |
| Frank Pallone | |||
| 4th | 44.2% | 55.8% | Chris Smith |
| 5th | 33.3% | 66.7% | Marge Roukema |
| 6th | 46.7% | 53.3% | Bernard J. Dwyer |
| 7th | 40.7% | 59.3% | Matthew J. Rinaldo |
| 8th | 45.5% | 54.5% | Robert A. Roe |
| 9th | 46.4% | 53.6% | Robert Torricelli |
| 10th | 74.3% | 19.7% | Peter Rodino |
| Donald M. Payne | |||
| 11th | 35.2% | 64.8% | Dean Gallo |
| 12th | 37.7% | 62.3% | Jim Courter |
| 13th | 38.2% | 61.8% | Jim Saxton |
| 14th | 55.1% | 44.9% | Frank Guarini |
See also
editReferences
edit- ^ "1988 Presidential General Election Results - New Jersey". Dave Leip's Atlas of U.S. Presidential Elections. Retrieved November 14, 2013.
- ^ Sullivan, Robert David; ‘How the Red and Blue Map Evolved Over the Past Century’; America Magazine in The National Catholic Review; June 29, 2016
- ^ "Our Campaigns - NJ US President - Nov 08, 1988".
- ^ "1988 United States Presidential Election, Results by Congressional District". Western Washington University. Retrieved March 21, 2022.


