2000 United States presidential election in Mississippi
The 2000 United States presidential election in Mississippi took place on November 7, 2000, and was part of the 2000 United States presidential election. Voters chose seven representatives, or electors to the Electoral College, who voted for president and vice president.
| ||||||||||||||||||||||||||
| ||||||||||||||||||||||||||
| ||||||||||||||||||||||||||
| ||||||||||||||||||||||||||
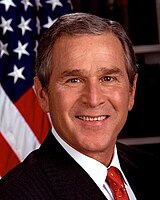
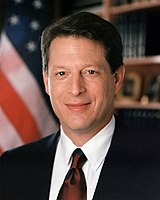
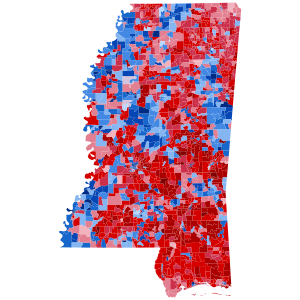
Mississippi was won by Governor George W. Bush with a double-digit margin of victory of 16.92%. Bush won most of the counties and congressional districts of the state. Bush dominated the east part of the state and Gore did well in the west. As of the 2024 presidential election[update], this is the last election in which Yalobusha County voted for the Democratic candidate. This is also the last election in which Mississippi voted to the right of neighboring Alabama. Bush became the first Republican to win the White House without carrying Adams or Hinds Counties since Richard Nixon in 1968.
Campaign
editPredictions
edit| Source | Rating | As of |
|---|---|---|
| The Orlando Sentinel[1] | Safe R | September 10, 2000 |
| The News and Observer[2] | Likely R | October 18, 2000 |
| Richmond Times-Dispatch[3] | Safe R | October 29, 2000 |
| The Central New Jersey Home News[4] | Solid R | November 2, 2000 |
| Los Angeles Times[5] | Safe R | November 3, 2000 |
Results
edit| 2000 United States presidential election in Mississippi[6] | |||||
|---|---|---|---|---|---|
| Party | Candidate | Votes | Percentage | Electoral votes | |
| Republican | George W. Bush | 573,230 | 57.6% | 7 | |
| Democratic | Al Gore | 404,964 | 40.7% | 0 | |
| Green | Ralph Nader | 8,126 | 0.8% | 0 | |
| Constitution | Howard Phillips | 3,267 | 0.3% | 0 | |
| Reform | Patrick Buchanan | 2,267 | 0.2% | 0 | |
| Libertarian | Harry Browne | 2,009 | 0.2% | 0 | |
| Socialist Workers | James Harris | 613 | 0.1% | 0 | |
| Natural Law | John Hagelin | 450 | 0.1% | 0 | |
| Totals | - | 100.00% | 7 | ||
| Voter turnout (Voting age/registered) | 48%/57% | ||||
Results by county
edit| County | George W. Bush Republican |
Al Gore Democratic |
Various candidates Other parties |
Margin | Total | ||||
|---|---|---|---|---|---|---|---|---|---|
| # | % | # | % | # | % | # | % | ||
| Adams | 6,691 | 44.97% | 8,065 | 54.20% | 123 | 0.83% | -1,374 | -9.23% | 14,879 |
| Alcorn | 7,254 | 57.40% | 5,059 | 40.03% | 325 | 2.57% | 2,195 | 17.37% | 12,638 |
| Amite | 3,677 | 57.38% | 2,673 | 41.71% | 58 | 0.91% | 1,004 | 15.67% | 6,408 |
| Attala | 4,206 | 58.64% | 2,922 | 40.74% | 45 | 0.63% | 1,284 | 17.90% | 7,173 |
| Benton | 1,561 | 44.84% | 1,886 | 54.18% | 34 | 0.98% | -156 | -9.34% | 3,481 |
| Bolivar | 4,847 | 35.80% | 8,436 | 62.31% | 255 | 1.88% | -3,589 | -26.51% | 13,538 |
| Calhoun | 3,448 | 59.88% | 2,251 | 39.09% | 59 | 1.02% | 1,197 | 20.79% | 5,758 |
| Carroll | 3,165 | 64.28% | 1,726 | 35.05% | 33 | 0.67% | 1,439 | 29.23% | 4,924 |
| Chickasaw | 3,549 | 49.46% | 3,519 | 49.05% | 107 | 1.49% | 30 | 0.41% | 7,175 |
| Choctaw | 2,398 | 64.48% | 1,278 | 34.36% | 43 | 1.16% | 1,120 | 30.12% | 3,719 |
| Claiborne | 883 | 19.13% | 3,670 | 79.52% | 62 | 1.34% | -2,787 | -60.39% | 4,615 |
| Clarke | 4,503 | 65.08% | 2,368 | 34.22% | 48 | 0.69% | 2,135 | 30.86% | 6,919 |
| Clay | 3,570 | 43.72% | 4,515 | 55.30% | 80 | 0.98% | -945 | -11.58% | 8,165 |
| Coahoma | 3,695 | 38.68% | 5,662 | 59.27% | 196 | 2.05% | -1,967 | -20.59% | 9,553 |
| Copiah | 5,643 | 53.30% | 4,845 | 45.76% | 99 | 0.94% | 798 | 7.54% | 10,587 |
| Covington | 4,180 | 60.75% | 2,623 | 38.12% | 78 | 1.13% | 1,557 | 22.63% | 6,881 |
| DeSoto | 24,879 | 71.21% | 9,586 | 27.44% | 471 | 1.35% | 15,293 | 43.77% | 34,936 |
| Forrest | 13,281 | 59.69% | 8,500 | 38.20% | 470 | 2.11% | 4,781 | 21.49% | 22,251 |
| Franklin | 2,427 | 61.40% | 1,486 | 37.59% | 40 | 1.01% | 941 | 23.81% | 3,953 |
| George | 5,143 | 70.61% | 1,977 | 27.14% | 164 | 2.25% | 3,166 | 43.47% | 7,284 |
| Greene | 3,082 | 69.48% | 1,317 | 29.69% | 37 | 0.83% | 1,765 | 39.79% | 4,436 |
| Grenada | 5,129 | 54.65% | 4,163 | 44.36% | 93 | 0.99% | 966 | 10.29% | 9,385 |
| Hancock | 9,326 | 64.11% | 4,801 | 33.00% | 421 | 2.89% | 4,525 | 31.11% | 14,548 |
| Harrison | 32,256 | 61.30% | 19,142 | 36.38% | 1,218 | 2.31% | 13,114 | 24.92% | 52,616 |
| Hinds | 37,753 | 43.01% | 46,789 | 53.31% | 3,228 | 3.68% | -9,036 | -10.30% | 87,770 |
| Holmes | 1,937 | 26.10% | 5,447 | 73.39% | 38 | 0.51% | -3,510 | -47.29% | 7,422 |
| Humphreys | 1,628 | 41.28% | 2,288 | 58.01% | 28 | 0.71% | -660 | -16.73% | 3,944 |
| Issaquena | 366 | 38.89% | 555 | 58.98% | 20 | 2.13% | -189 | -20.09% | 941 |
| Itawamba | 5,424 | 63.33% | 2,994 | 34.96% | 146 | 1.70% | 2,430 | 28.37% | 8,564 |
| Jackson | 30,068 | 66.66% | 14,193 | 31.47% | 846 | 1.88% | 15,875 | 35.19% | 45,107 |
| Jasper | 3,294 | 51.09% | 3,104 | 48.15% | 49 | 0.76% | 190 | 2.94% | 6,447 |
| Jefferson | 600 | 17.61% | 2,786 | 81.75% | 22 | 0.65% | -2,186 | -64.14% | 3,408 |
| Jefferson Davis | 2,437 | 45.83% | 2,835 | 53.32% | 45 | 0.85% | -398 | -7.49% | 5,317 |
| Jones | 16,341 | 67.14% | 7,713 | 31.69% | 286 | 1.18% | 8,628 | 35.45% | 24,340 |
| Kemper | 1,915 | 44.94% | 2,311 | 54.24% | 35 | 0.82% | -396 | -9.30% | 4,261 |
| Lafayette | 7,081 | 55.85% | 5,139 | 40.53% | 458 | 3.61% | 1,942 | 15.32% | 12,678 |
| Lamar | 12,795 | 77.07% | 3,478 | 20.95% | 329 | 1.98% | 9,317 | 56.12% | 16,602 |
| Lauderdale | 17,315 | 66.67% | 8,412 | 32.39% | 243 | 0.94% | 8,903 | 34.28% | 25,970 |
| Lawrence | 3,674 | 55.78% | 2,841 | 43.13% | 72 | 1.09% | 833 | 12.65% | 6,587 |
| Leake | 4,114 | 59.18% | 2,793 | 40.18% | 45 | 0.65% | 1,321 | 19.00% | 6,952 |
| Lee | 15,551 | 61.97% | 9,142 | 36.43% | 401 | 1.60% | 6,409 | 25.54% | 25,094 |
| Leflore | 4,626 | 41.03% | 6,401 | 56.77% | 249 | 2.21% | -1,775 | -15.74% | 11,276 |
| Lincoln | 8,540 | 65.69% | 4,358 | 33.52% | 102 | 0.78% | 4,182 | 32.17% | 13,000 |
| Lowndes | 11,404 | 59.30% | 7,537 | 39.19% | 289 | 1.50% | 3,867 | 20.11% | 19,230 |
| Madison | 19,109 | 64.00% | 10,416 | 34.88% | 334 | 1.12% | 8,693 | 29.12% | 29,859 |
| Marion | 6,796 | 61.79% | 4,114 | 37.41% | 88 | 0.80% | 2,682 | 24.38% | 10,998 |
| Marshall | 4,723 | 37.51% | 7,735 | 61.43% | 134 | 1.06% | -3,012 | -23.92% | 12,592 |
| Monroe | 7,397 | 55.37% | 5,783 | 43.29% | 180 | 1.35% | 1,614 | 12.08% | 13,360 |
| Montgomery | 2,630 | 54.24% | 2,187 | 45.10% | 32 | 0.66% | 443 | 9.14% | 4,849 |
| Neshoba | 6,409 | 70.69% | 2,563 | 28.27% | 94 | 1.04% | 3,846 | 42.42% | 9,066 |
| Newton | 5,540 | 71.59% | 2,147 | 27.75% | 51 | 0.66% | 3,393 | 43.84% | 7,738 |
| Noxubee | 1,530 | 30.88% | 3,383 | 68.29% | 41 | 0.83% | -1,853 | -37.41% | 4,954 |
| Oktibbeha | 7,959 | 53.76% | 6,443 | 43.52% | 402 | 2.72% | 1,516 | 10.24% | 14,804 |
| Panola | 5,424 | 47.62% | 5,880 | 51.63% | 85 | 0.75% | -456 | -4.01% | 11,389 |
| Pearl River | 11,575 | 70.25% | 4,611 | 27.98% | 291 | 1.77% | 6,964 | 42.27% | 16,477 |
| Perry | 3,026 | 69.42% | 1,285 | 29.48% | 48 | 1.10% | 1,741 | 39.94% | 4,359 |
| Pike | 7,464 | 52.69% | 6,544 | 46.20% | 158 | 1.12% | 920 | 6.49% | 14,166 |
| Pontotoc | 6,601 | 69.41% | 2,771 | 29.14% | 138 | 1.45% | 3,830 | 40.27% | 9,510 |
| Prentiss | 5,101 | 60.14% | 3,287 | 38.75% | 94 | 1.11% | 1,814 | 21.39% | 8,482 |
| Quitman | 1,280 | 37.50% | 2,103 | 61.62% | 30 | 0.88% | -823 | -24.12% | 3,413 |
| Rankin | 32,983 | 79.60% | 8,050 | 19.43% | 402 | 0.97% | 24,933 | 60.17% | 41,435 |
| Scott | 5,601 | 60.84% | 3,548 | 38.54% | 57 | 0.62% | 2,053 | 22.30% | 9,206 |
| Sharkey | 1,074 | 37.00% | 1,706 | 58.77% | 123 | 4.24% | -632 | -21.77% | 2,903 |
| Simpson | 6,254 | 65.32% | 3,227 | 33.71% | 93 | 0.97% | 3,027 | 31.61% | 9,574 |
| Smith | 4,838 | 74.11% | 1,620 | 24.82% | 70 | 1.07% | 3,218 | 49.29% | 6,528 |
| Stone | 3,702 | 67.03% | 1,677 | 30.36% | 144 | 2.61% | 2,025 | 36.67% | 5,523 |
| Sunflower | 3,369 | 40.04% | 4,981 | 59.19% | 65 | 0.77% | -1,612 | -19.15% | 8,415 |
| Tallahatchie | 2,428 | 43.96% | 3,041 | 55.06% | 54 | 0.98% | -613 | -11.10% | 5,523 |
| Tate | 5,148 | 59.22% | 3,441 | 39.58% | 104 | 1.20% | 1,707 | 19.64% | 8,693 |
| Tippah | 5,381 | 64.04% | 2,908 | 34.61% | 114 | 1.36% | 2,473 | 29.43% | 8,403 |
| Tishomingo | 4,122 | 58.95% | 2,747 | 39.29% | 123 | 1.76% | 1,375 | 19.66% | 6,992 |
| Tunica | 792 | 33.47% | 1,539 | 65.05% | 35 | 1.48% | -747 | -31.58% | 2,366 |
| Union | 6,087 | 65.37% | 3,094 | 33.23% | 130 | 1.40% | 2,993 | 32.14% | 9,311 |
| Walthall | 3,476 | 58.97% | 2,356 | 39.97% | 63 | 1.07% | 1,120 | 19.00% | 5,895 |
| Warren | 10,892 | 58.49% | 7,485 | 40.19% | 246 | 1.32% | 3,407 | 18.30% | 18,623 |
| Washington | 7,367 | 40.20% | 10,405 | 56.77% | 556 | 3.03% | -3,038 | -16.57% | 18,328 |
| Wayne | 4,635 | 60.16% | 2,981 | 38.69% | 89 | 1.16% | 1,654 | 21.47% | 7,705 |
| Webster | 3,069 | 67.52% | 1,426 | 31.38% | 50 | 1.10% | 1,643 | 36.14% | 4,545 |
| Wilkinson | 1,423 | 34.72% | 2,551 | 62.25% | 124 | 3.03% | -1,128 | -27.53% | 4,098 |
| Winston | 4,645 | 55.51% | 3,672 | 43.88% | 51 | 0.61% | 973 | 11.63% | 8,368 |
| Yalobusha | 2,470 | 47.25% | 2,674 | 51.15% | 84 | 1.61% | -204 | -3.90% | 5,228 |
| Yazoo | 5,254 | 49.96% | 4,997 | 47.52% | 265 | 2.52% | 257 | 2.44% | 10,516 |
| Totals | 573,230 | 57.62% | 404,964 | 40.70% | 16,732 | 1.68% | 168,266 | 16.92% | 944,926 |
Counties that flipped from Democratic to Republican
edit- Alcorn (largest city: Corinth)
- Amite (largest city: Gloster)
- Chickasaw (largest city: Okolona)
- Copiah (largest city: Hazlehurst)
- Jasper (largest city: Bay Springs)
- Lawrence (largest city: Monticello)
- Montgomery (largest city: Winona)
- Pike (largest city: Magnolia)
- Walthall (largest city: Tylertown)
- Yazoo (largest city: Yazoo City)
Results by congressional district
editBush won four of five congressional districts, including two held by Democrats.
| District | Bush | Gore | Representative |
|---|---|---|---|
| 1st | 60% | 38% | Roger Wicker |
| 2nd | 39% | 59% | Bennie G. Thompson |
| 3rd | 67% | 32% | Chip Pickering |
| 4th | 54% | 44% | Ronnie Shows |
| 5th | 66% | 32% | Gene Taylor |
Electors
editTechnically the voters of Mississippi cast their ballots for electors: representatives to the Electoral College. Mississippi is allocated seven electors because it has five congressional districts and two senators. All candidates who appear on the ballot or qualify to receive write-in votes must submit a list of seven electors, who pledge to vote for their candidate and his or her running mate. Whoever wins the majority of votes in the state is awarded all 7 electoral votes. Their chosen electors then vote for president and vice president. Although electors are pledged to their candidate and running mate, they are not obligated to vote for them. An elector who votes for someone other than his or her candidate is known as a faithless elector.
The electors of each state and the District of Columbia met on December 18, 2000[7] to cast their votes for president and vice president. The Electoral College itself never meets as one body. Instead the electors from each state and the District of Columbia met in their respective capitols.
The following were the members of the Electoral College from the state. All were pledged to and voted for George W. Bush and Dick Cheney:[8]
- Bob Anthony
- Miki Cassidy
- Thomas Colbert
- Delbert Hosemann
- Ellen Reineke
- John Junkin
- Kent Nicaud
References
edit- ^ Brown, Peter A. (September 10, 2000). "Electoral College Analysis Shows the Race Is a Dead Heat: Florida Could Be Decisive This November". The Orlando Sentinel. pp. G1, G4.
- ^ "The Prize Is Still out There". The News and Observer. Raleigh, North Carolina. October 18, 2000. p. 14A.
- ^ "Bush Has Small Electoral Lead". Richmond Times-Dispatch. The Associated Press. October 29, 2000. p. A8.
- ^ Raasch, Chuck (November 2, 2000). "Vote May Be Closest in 40 Years: Presidential Outcome Expected to Hinge on Swing States". The Central New Jersey Home News. New Brunswick, New Jersey. pp. A1, A6.
- ^ Brownstein, Ronald. "Popular-Vote Winner Could End Up a Loser — NUMBERS: Pollsters See Visions of 1888 Cleveland Victorywork=Los Angeles Timesdate=November 3, 2000". Los Angeles, California. pp. A1, A5.
- ^ "2000 Presidential General Election Results — Mississippi".
- ^ "2000 Post-Election Timeline of Events".
- ^ "President Elect - 2000". Archived from the original on February 12, 2012. Retrieved October 31, 2009.


