1996 United States presidential election in Massachusetts
The 1996 United States presidential election in Massachusetts took place on November 5, 1996, as part of the 1996 United States presidential election. Voters chose 12 representatives, or electors to the Electoral College, who voted for president and vice president.
| |||||||||||||||||||||||||||||||||
| |||||||||||||||||||||||||||||||||
| |||||||||||||||||||||||||||||||||
| |||||||||||||||||||||||||||||||||
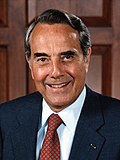
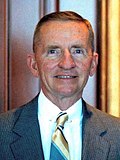
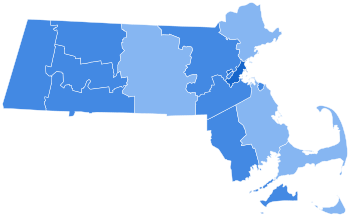
A solidly blue state, Massachusetts was won by incumbent Democratic President Bill Clinton in a landslide. Clinton took 61.47% of the popular vote over Republican challenger Bob Dole, who took 28.09%, a victory margin of 33.39%. Reform Party candidate Ross Perot finished in third, with 8.89% of the popular vote.[1]
Like New England as a whole, Massachusetts is a largely secular and liberal society in the modern era, and thus it rejected an increasingly conservative Republican Party dominated by Evangelical Christians.
Massachusetts had been a Democratic-leaning state since 1928, when voted for Democrat Catholic candidate Al Smith, and a Democratic stronghold since 1960. In fact, Clinton's landslide victory was indicative of a long-term trend in Massachusetts back toward being the overwhelmingly Democratic stronghold it had been in the 1960s, after having trended somewhat toward the GOP in 1976 and the 1980s. Clinton's 61.47% was the highest percentage a presidential candidate had received in Massachusetts since 1968, and his 33.39% victory margin was the widest margin by which any candidate won the state since the massive Democratic landslide of 1964, a record that would not be broken again until 2020.
Massachusetts was the only state in the union where Clinton broke 60% of the vote in 1996, with only the District of Columbia voting more Democratic. Massachusetts registered as a significant 25% more Democratic than the national average, making it the most Democratic state in the 1996 election. As of 2020, this is the last occasion that the town of Sherborn voted Republican and the last occasion that the towns of Blandford, East Brookfield, Hampden, Hubbardston, Montgomery, Oakham, Southwick, Tolland, and West Bridgewater voted Democratic in a presidential election.
Results
edit| 1996 United States presidential election in Massachusetts | |||||
|---|---|---|---|---|---|
| Party | Candidate | Votes | Percentage | Electoral votes | |
| Democratic | Bill Clinton (incumbent) | 1,571,763 | 61.47% | 12 | |
| Republican | Bob Dole | 718,107 | 28.09% | 0 | |
| Reform | Ross Perot | 227,217 | 8.89% | 0 | |
| Libertarian | Harry Browne | 20,426 | 0.80% | 0 | |
| Independent (Write-In) | Others | 6,012 | 0.24% | 0 | |
| Natural Law | John Hagelin | 5,184 | 0.20% | 0 | |
| Green (Write-in) | Ralph Nader | 4,734 | 0.19% | 0 | |
| Workers World | Monica Moorehead | 3,277 | 0.13% | 0 | |
| Socialist (Write-In) | Mary Cal Hollis | 61 | <0.01% | 0 | |
| Prohibition (Write-In) | Earl Dodge | 4 | <0.01% | 0 | |
| Totals | 2,556,785 | 100.0% | 12 | ||
Results by county
edit| County | Bill Clinton Democratic |
Bob Dole Republican |
Various candidates Other parties |
Margin | Total votes cast | ||||
|---|---|---|---|---|---|---|---|---|---|
| # | % | # | % | # | % | # | % | ||
| Barnstable | 59,223 | 53.48% | 40,144 | 36.25% | 11,370 | 10.27% | 19,079 | 17.23% | 110,737 |
| Berkshire | 39,338 | 64.73% | 13,055 | 21.48% | 8,381 | 13.79% | 26,283 | 43.25% | 60,774 |
| Bristol | 127,725 | 64.44% | 47,164 | 23.79% | 23,324 | 11.77% | 80,561 | 40.65% | 198,213 |
| Dukes | 5,137 | 66.70% | 1,739 | 22.58% | 826 | 10.72% | 3,398 | 44.12% | 7,702 |
| Essex | 171,021 | 58.68% | 89,120 | 30.58% | 31,301 | 10.74% | 81,901 | 28.10% | 291,442 |
| Franklin | 19,728 | 60.25% | 8,055 | 24.60% | 4,959 | 15.15% | 11,673 | 35.65% | 32,742 |
| Hampden | 105,050 | 60.99% | 48,513 | 28.17% | 18,676 | 10.84% | 56,537 | 32.82% | 172,239 |
| Hampshire | 41,844 | 64.07% | 14,787 | 22.64% | 8,678 | 13.29% | 27,057 | 41.43% | 65,309 |
| Middlesex | 398,190 | 63.41% | 169,926 | 27.06% | 59,861 | 9.53% | 228,264 | 36.35% | 627,977 |
| Nantucket | 2,453 | 58.98% | 1,222 | 29.38% | 484 | 11.64% | 1,231 | 29.60% | 4,159 |
| Norfolk | 180,504 | 60.07% | 92,982 | 30.95% | 26,985 | 8.98% | 87,522 | 29.12% | 300,471 |
| Plymouth | 106,072 | 54.67% | 64,626 | 33.31% | 23,313 | 12.02% | 41,446 | 21.36% | 194,011 |
| Suffolk | 145,586 | 73.01% | 39,753 | 19.94% | 14,053 | 7.05% | 105,833 | 53.07% | 199,392 |
| Worcester | 169,892 | 58.26% | 87,021 | 29.84% | 34,704 | 11.90% | 82,871 | 28.42% | 291,617 |
| Totals | 1,571,763 | 61.47% | 718,107 | 28.09% | 266,915 | 10.44% | 853,656 | 33.38% | 2,556,785 |
Results by municipality
editSee also
editReferences
edit- ^ "1996 Presidential General Election Results". U.S. Election Atlas. Retrieved January 8, 2013.


