2016 United States presidential election in Delaware
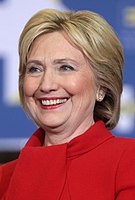
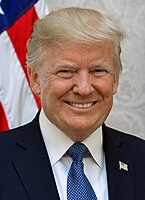
The 2016 United States presidential election in Delaware was held on Tuesday, November 8, 2016, as part of the 2016 United States presidential election in which all 50 states plus the District of Columbia participated. Delaware voters chose electors to represent them in the Electoral College via a popular vote, pitting the Republican Party's nominee, businessman Donald Trump, and running mate Indiana Governor Mike Pence against Democratic Party nominee, former Secretary of State Hillary Clinton, and her running mate Virginia Senator Tim Kaine. Delaware has three electoral votes in the Electoral College.[1]
| ||||||||||||||||||||||||||
| Turnout | 65.35% | |||||||||||||||||||||||||
|---|---|---|---|---|---|---|---|---|---|---|---|---|---|---|---|---|---|---|---|---|---|---|---|---|---|---|
| ||||||||||||||||||||||||||
| ||||||||||||||||||||||||||
| ||||||||||||||||||||||||||

Clinton carried the state with 53.1% of the vote to Trump's 41.7%, a victory margin of 11.38%[2] Although Democrats continued their streak of winning Delaware, a state that has not gone to the Republicans in a presidential election since 1988, it swung 7.19% to the right relative to 2012, and Trump managed to flip Kent County. This was the first time since 1968 that Delaware did not vote for the same candidate as neighboring Pennsylvania.
Primary elections
editDemocratic primary
editFive candidates appeared on the Democratic presidential primary ballot:
Opinion polling
editResults
edit
| Candidate | Popular vote | Estimated delegates | |||
|---|---|---|---|---|---|
| Count | Percentage | Pledged | Unpledged | Total | |
| Hillary Clinton | 55,954 | 59.75% | 12 | 11 | 23 |
| Bernie Sanders | 36,662 | 39.15% | 9 | 0 | 9 |
| Roque De La Fuente | 1,024 | 1.09% | |||
| Uncommitted | — | 0 | 0 | 0 | |
| Total | 93,640 | 100% | 21 | 11 | 32 |
| Source: [3][4] | |||||
Republican primary
edit- 50–60%
- 60–70%
- 70–80%
Six candidates appeared on the Republican presidential primary ballot:[5]
- Jeb Bush (withdrawn)
- Ben Carson (withdrawn)
- Ted Cruz
- John Kasich
- Marco Rubio (suspended, to convention)
- Donald Trump
Opinion polling
editResults
edit| Candidate | Votes | Percentage | Actual delegate count | ||
|---|---|---|---|---|---|
| Bound | Unbound | Total | |||
| Donald Trump | 42,472 | 60.77% | 16 | 0 | 16 |
| John Kasich | 14,225 | 20.35% | 0 | 0 | 0 |
| Ted Cruz | 11,110 | 15.90% | 0 | 0 | 0 |
| Ben Carson (withdrawn) | 885 | 1.27% | 0 | 0 | 0 |
| Marco Rubio (withdrawn) | 622 | 0.89% | 0 | 0 | 0 |
| Jeb Bush (withdrawn) | 578 | 0.83% | 0 | 0 | 0 |
| Unprojected delegates: | 0 | 0 | 0 | ||
| Total: | 69,892 | 100.00% | 16 | 0 | 16 |
| Source: The Green Papers | |||||
Green convention
editOn April 2, 2016, the Green Party of Delaware announced that all four of its delegates would support Jill Stein at the national convention.[6]
| Candidate | Votes | Percentage | National delegates |
|---|---|---|---|
| Jill Stein | 14 | 100% | 4 |
| William Kreml | - | - | - |
| Sedinam Kinamo Christin Moyowasifza Curry | - | - | - |
| Kent Mesplay | - | - | - |
| Darryl Cherney | - | - | - |
| Total | 14 | 100% | 4 |
General election
editPredictions
edit| Source | Ranking | As of |
|---|---|---|
| Los Angeles Times[7] | Safe D | November 6, 2016 |
| CNN[8] | Safe D | November 4, 2016 |
| Cook Political Report[9] | Safe D | November 7, 2016 |
| Electoral-vote.com[10] | Safe D | November 8, 2016 |
| Sabato's Crystal Ball[11] | Safe D | November 7, 2016 |
| Fox News[12] | Safe D | November 7, 2016 |
Polling
editResults
edit| Party | Candidate | Votes | % | |
|---|---|---|---|---|
| Democratic | Hillary Clinton | 235,603 | 53.09% | |
| Republican | Donald Trump | 185,127 | 41.71% | |
| Libertarian | Gary Johnson | 14,757 | 3.33% | |
| Green | Jill Stein | 6,103 | 1.37% | |
| Independent | Evan McMullin (write-in) | 706 | 0.16% | |
| Constitution | Darrell Castle (write-in) | 74 | 0.02% | |
| Write-in (other) | 1,444 | 0.32% | ||
| Total votes | 443,814 | 100.00% | ||
By county
edit| County | Hillary Clinton Democratic |
Donald Trump Republican |
Various candidates Other parties |
Margin | Total votes cast | ||||
|---|---|---|---|---|---|---|---|---|---|
| # | % | # | % | # | % | # | % | ||
| Kent | 33,351 | 44.63% | 36,991 | 49.50% | 4,387 | 5.87% | -3,640 | -4.87% | 74,729 |
| New Castle | 162,919 | 61.95% | 85,525 | 32.52% | 14,535 | 5.53% | 77,394 | 29.43% | 262,979 |
| Sussex | 39,333 | 37.07% | 62,611 | 59.01% | 4,162 | 3.92% | -23,278 | -21.94% | 106,106 |
| Totals | 235,603 | 53.09% | 185,127 | 41.71% | 23,084 | 5.20% | 50,476 | 11.38% | 443,814 |
Counties that flipped from Democratic to Republican
By congressional district
editDue to the state's low population, only one congressional district is allocated. This district is called the at-large district, because it covers the entire state, and thus is equivalent to the statewide election results.
| District | Trump | Clinton | Representative |
|---|---|---|---|
| At-large | 41.72% | 53.09% | Lisa Blunt Rochester |
Turnout
editAccording to Delaware's Elections website, voter turnout was 65.57% with 445,228 ballots cast out of 679,027 registered voters.[16]
See also
editReferences
edit- ^ "Distribution of Electoral Votes". National Archives and Records Administration. Retrieved November 23, 2020.
- ^ "Connecticut Election Results 2016 – The New York Times". Retrieved November 10, 2016.
- ^ The Green Papers
- ^ Delaware Department of Elections - Official Primary Results
- ^ "State of Delaware - Department of Elections · Office of the State Election Commissioner". elections.delaware.gov. Retrieved June 20, 2016.
- ^ "GPDE Annual Meeting Notes 2016-04-02". Retrieved May 4, 2016.
- ^ "Our final map has Clinton winning with 352 electoral votes. Compare your picks with ours". Los Angeles Times. November 6, 2016. Retrieved November 13, 2016.
- ^ Chalian, David (November 4, 2016). "Road to 270: CNN's new election map". CNN. Retrieved March 3, 2019.
- ^ "2016 Electoral Scorecard". The Cook Political Report. November 7, 2016. Archived from the original on February 16, 2017. Retrieved March 3, 2019.
- ^ "2016 Electoral Map Prediction". Electoral-vote.com. November 8, 2016. Retrieved March 3, 2019.
- ^ Sabato, Larry J. (November 7, 2016). "2016 President". University of Virginia Center for Politics. Retrieved March 3, 2019.
- ^ "Electoral Scorecard: Map shifts again in Trump's favor, as Clinton holds edge". Fox News. November 7, 2016. Retrieved November 13, 2016.
- ^ "http://elections.delaware.gov/results/html/stwoff_kns.shtml/ Archived 2017-01-30 at the Wayback Machine"
- ^ "http://elections.delaware.gov/results/pdf/2016%20General%20Election%20-%20Write-In%20Candidates%20Votes.pdf Archived 2017-01-30 at the Wayback Machine"
- ^ Bump, Philip. "The counties that flipped parties to swing the 2016 election". Washington Post. ISSN 0190-8286. Retrieved September 1, 2020.
- ^ https://elections.delaware.gov/reports/pdfs/agprpt_2016.pdf Page 1 Last edited 2016-21-16 Retrieved 2020-07-08


