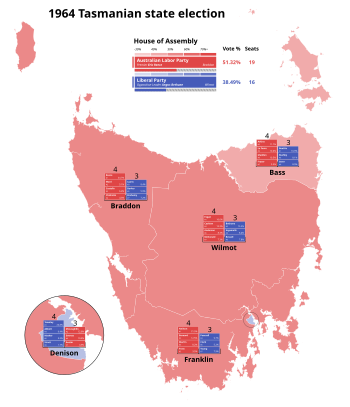
The 1964 Tasmanian state election was held on 2 May 1964 in the Australian state of Tasmania to elect 35 members of the Tasmanian House of Assembly. The election used the Hare-Clark proportional representation system[1] — seven members were elected from each of five electorates.
| ||||||||||||||||||||||||||||||||||
All 35 seats to the House of Assembly | ||||||||||||||||||||||||||||||||||
|---|---|---|---|---|---|---|---|---|---|---|---|---|---|---|---|---|---|---|---|---|---|---|---|---|---|---|---|---|---|---|---|---|---|---|
| ||||||||||||||||||||||||||||||||||
 Results of the election | ||||||||||||||||||||||||||||||||||
| ||||||||||||||||||||||||||||||||||
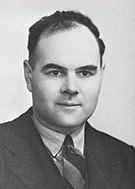
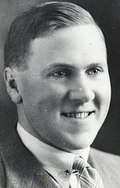
The Labor Party, in power since 1934, was seeking a tenth term in office, and Premier Eric Reece was contesting his second election in that role, this time against Leader of the Opposition Angus Bethune of the Liberal Party. Despite its longevity, the peculiarities of the Tasmanian Hare-Clark system meant it had served as a minority government with the support of independents since the 1946 election.
This is to date the last time that a sitting Premier, in Reece, has won back to back elections and was the first and only time that a Tasmanian Government won a tenth consecutive term in office.
Results
editLabor won a majority in the House of Assembly with 19 of the 35 seats. Dr Reg Turnbull, the former Labor treasurer who had won 27.9% as an independent in Bass in 1959 (equal to 5.64% of the statewide vote) departed in 1961 for the Australian Senate, with most of his vote returning to his former party.
| Party | Votes | % | +/– | Seats | +/– | |
|---|---|---|---|---|---|---|
| Labor | 90,631 | 51.32 | +6.82 | 19 | 2 | |
| Liberal | 67,971 | 38.49 | -2.57 | 16 | ||
| Country | 9,280 | 5.26 | +5.26 | 0 | ||
| Independents | 5,462 | 3.09 | -5.96 | 0 | 2 | |
| Democratic Labor | 3,155 | 1.79 | -3.50 | 0 | ||
| Communist | 92 | 0.05 | -0.04 | 0 | ||
| Total | 176,591 | 100.00 | – | 35 | – | |
| Valid votes | 176,591 | 95.68 | ||||
| Invalid/blank votes | 7,980 | 4.32 | -1.44 | |||
| Total votes | 184,571 | 100.00 | – | |||
| Registered voters/turnout | 193,418 | 95.43 | +0.86 | |||
Distribution of votes
editPrimary vote by division
edit| Bass | Braddon | Denison | Franklin | Wilmot | |
|---|---|---|---|---|---|
| Labor Party | 49.9% | 56.6% | 44.0% | 53.2% | 52.3% |
| Liberal Party | 41.2% | 32.9% | 44.9% | 36.5% | 37.5% |
| Other | 9.0% | 10.5% | 11.1% | 10.4% | 10.3% |
Distribution of seats
editSee also
editReferences
editExternal links
edit- Assembly Election Results, 1964, Parliament of Tasmania.
- Report on Parliamentary Elections, 1964, Tasmanian Electoral Commission.

