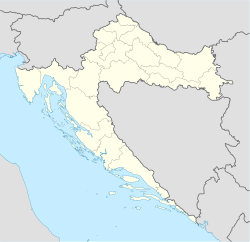
Sjeničak Lasinjski is a village in central Croatia, in the municipality of Lasinja, Karlovac County.
Sjeničak Lasinjski | |
|---|---|
Village | |
| Coordinates: 45°27′20″N 15°47′50″E / 45.45556°N 15.79722°E | |
| Country | |
| Region | Continental Croatia |
| County | Karlovac |
| Municipality | Lasinja |
| Area | |
• Total | 24.6 km2 (9.5 sq mi) |
| Elevation | 205 m (673 ft) |
| Population (2021)[2] | |
• Total | 106 |
| • Density | 4.3/km2 (11/sq mi) |
| Time zone | UTC+1 (CET) |
| • Summer (DST) | UTC+2 (CEST) |
| Postal code | 47213 Sjeničak Lasinjski |
| Area code | (+385) 047 |
History
editToday's name Sjeničak originates from the medieval town of Steničnjak, built at the beginning of the 12th century. Name is derived from tit (sjenice in Croatian) and the municipality of Lasinja.
On 21 September 1897, residents of Sjeničak Lasinjski rose in rebellion (known as Sjeničak rebellion, Croatian: Sjeničarska buna) against (perceived) Hungarisation and loss of privileges previously granted to them as border guards.
A number of young men from the village, Dr. Gojko Nikoliš being one of them, went to Spain to fight as members of the International Brigade in 1936-1937.
Sjeničak Lasinjski suffered significant demographic losses in the World War II with 352 of its residents perishing. Out of those, 137 were civilian victims of fascism, 68 were fallen partisans and 111 succumbed to typhoid.[3]
Culture
editThe first Serbian Orthodox Parish in the village, which included the village of Prkos Lasinjski, was established in 1715. The first school was established in 1834.[4]
Demographics
editAccording to the 2011 census,[5] the village of Sjeničak Lasinjski has 161 inhabitants. This represents 23.78% of its pre-war population according to the 1991 census.
The 1991 census[6] recorded that 93.35% of the village population were ethnic Serbs (632/677), 1.48% were ethnic Croats (10/677), 1.62% were Yugoslavs (11/677), while 3.55% were of other ethnic origin (24/677).
Sights
edit- Memorial to the victims of fascism and fallen partisans in WW2
Notable natives and residents
edit- Sava Mrkalj (1783–1833) - linguist and first reformer of the south-Slavic/Serbian Cyrillic alphabet
- Gojko Nikoliš (1911–1995) - medical doctor, historian, volunteer in International Brigades in Spanish Civil War, partisan general, the first Head of the Partisan Medical Corps, member of SANU[8] and People's Hero of Yugoslavia
- Miloš Kljajić (1916–1944) - antifascist and People's Hero of Yugoslavia after whom the village of Kljajićevo in Serbia was named
- Mile Mrkalj (1929–1993) - historian
References
edit- ^ Register of spatial units of the State Geodetic Administration of the Republic of Croatia. Wikidata Q119585703.
- ^ "Population by Age and Sex, by Settlements" (xlsx). Census of Population, Households and Dwellings in 2021. Zagreb: Croatian Bureau of Statistics. 2022.
- ^ Dušan Baić "Kotar Vrginmost u NO borbi 1941-1945."/"District of Vrginmost during National Liberation War 1941-1945: Sjeničak Lasinjski", pages 60-623, 1980
- ^ Dušan Baić "Kotar Vrginmost u NO borbi 1941-1945."/"District of Vrginmost during National Liberation War 1941-1945: Sjeničak Lasinjski", pages 60-623, 1980
- ^ a b "Population by Age and Sex, by Settlements, 2011 Census: Sjeničak Lasinjski". Census of Population, Households and Dwellings 2011. Zagreb: Croatian Bureau of Statistics. December 2012.
- ^ Izdanje Državnog zavoda za statistiku RH: Narodnosni sastav stanovništva RH od 1880–1991. godine.
- ^ Naselja i stanovništvo Republike Hrvatske 1857-2001, www.dzs.hr
- ^ "Dr. Gojko Nikoliš, SANU membership". sanu.ac.rs. Retrieved 29 August 2018.
