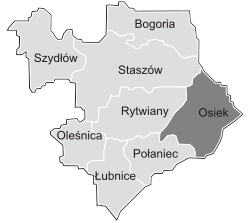
Gmina Osiek[2][3] is an urban-rural gmina (administrative district) in Staszów County, Świętokrzyskie Voivodeship, in south-central Poland. Its seat is the town of Osiek, which lies approximately 21 kilometres (13 mi) east of Staszów and 71 km (44 mi) south-east of the regional capital Kielce.
Gmina Osiek
Osiek Commune | |
|---|---|
 | |
| Coordinates (Osiek): 50°30′56.51″N 21°23′56.45″E / 50.5156972°N 21.3990139°E | |
| Country | |
| Voivodeship | Świętokrzyskie |
| County | Staszów |
| Seat | Osiek |
| Area (through the years 2006–2010)[1] | |
• Total | 129.30 km2 (49.92 sq mi) |
| Population (31 December 2010 at Census)[1] | |
• Total | 7,904 |
| • Density | 61/km2 (160/sq mi) |
| • Urban | 2,001 |
| • Rural | 5,903 |
| Time zone | UTC+1 (CET) |
| • Summer (DST) | UTC+2 (CEST) |
| Postal code | 28-221 |
| Area code | +48 15 |
| Car plates | TSZ |
The gmina covers an area of 129.30 square kilometres (49.9 sq mi), and as of 2010 its total population is ![]() 7,904 (out of which the population of Osiek amounts to
7,904 (out of which the population of Osiek amounts to ![]() 2,001, and the population of the rural part of the gmina is
2,001, and the population of the rural part of the gmina is ![]() 5,903).
5,903).
Demography
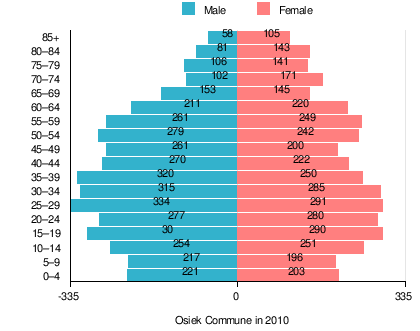
editAccording to the 2011 Poland census, there were 7,904 people residing in Osiek Commune, of whom 50.9% were male and 49.1% were female (out of which the population in rural areas amounts to 5,903, of whom 51.2% were male and 48.8% were female). In the commune, the population was spread out, with 21.2% under the age of 18, 39.3% from 18 to 44, 21.5% from 45 to 64, and 18% who were 65 years of age or older (out of which the population in rural areas amounts to 21.1% under the age of 18, 39.5% from 18 to 44, 20.9% from 45 to 64, and 18.5% who were 65 years of age or older).[1]
Table 1. Population level of commune in 2010 – by age group[1] SPECIFICATION Measure
unitPOPULATION
(by age group in 2010)TOTAL 0–4 5–9 10–14 15–19 20–24 25–29 30–34 35–39 40–44 45–49 50–54 55–59 60–64 65–69 70–74 75–79 80–84 85 + I. TOTAL person 7,904 424 413 505 590 557 625 600 570 492 461 521 510 431 298 273 247 224 163 — of which in % 100 5.4 5.2 6.4 7.5 7 7.9 7.6 7.2 6.2 5.8 6.7 6.5 5.5 3.7 3.5 3.1 2.8 2 1. BY SEX A. Males person 4,020 221 217 254 300 277 334 315 320 270 261 279 261 211 153 102 106 81 58 — of which in % 50.9 2.9 2.8 3.2 3.8 3.5 4.2 4 4 3.4 3.3 3.6 3.3 2.7 1.9 1.3 1.3 1 0.7 B. Females person 3,884 203 196 251 290 280 291 285 250 222 200 242 249 220 145 171 141 143 105 — of which in % 49.1 2.5 2.4 3.2 3.7 3.5 3.7 3.6 3.2 2.8 2.5 3.1 3.2 2.8 1.8 2.2 1.8 1.8 1.3
Table 2. Population level in rural areas in 2010 – by age group[1] SPECIFICATION Measure
unitPOPULATION
(by age group in 2010)TOTAL 0–4 5–9 10–14 15–19 20–24 25–29 30–34 35–39 40–44 45–49 50–54 55–59 60–64 65–69 70–74 75–79 80–84 85 + I. TOTAL person 5,903 308 332 364 445 414 474 443 420 379 320 371 382 330 217 212 189 174 129 — of which in % 100 5.2 5.6 6.2 7.5 7 8 7.5 7.1 6.4 5.4 6.3 6.5 5.6 3.7 3.6 3.2 2.9 2.2 1. BY SEX A. Males person 3,020 166 173 177 235 210 252 236 240 220 184 197 198 158 106 81 89 57 41 — of which in % 51.2 2.8 2.9 3 4 3.6 4.3 4 4.1 3.7 3.1 3.3 3.4 2.7 1.8 1.4 1.5 1 0.7 B. Females person 2,883 142 159 187 210 204 222 207 180 159 136 174 184 172 111 131 100 117 88 — of which in % 48.8 2.4 2.7 3.2 3.6 3.5 3.8 3.5 3 2.7 2.3 2.9 3.1 2.9 1.9 2.2 1.7 2 1.5
Table 3. Population level of commune in 2010 – by sex[1] SPECIFICATION Measure
unitPOPULATION
(by sex in 2010)TOTAL Males Females I. TOTAL person 7,904 4,020 3,884 — of which in % 100 50.9 49.1 1. BY AGE GROUP A. At pre-working age person 1,672 865 807 — of which in % 21.2 11 10.2 B. At working age, grand total person 4,807 2,655 2,152 — of which in % 60.8 33.6 27.2 a. at mobile working age person 3,104 1,643 1,461 — of which in | % 39.3 20.8 18.5 b. at non-mobile working age person 1,703 1,012 691 — of which in | % 21.5 12.8 8.7 C. At post-working age person 1,425 500 925 — of which in % 18 6.3 11.7
Table 4. Population level in rural areas in 2010 – by sex[1] SPECIFICATION Measure
unitPOPULATION
(by sex in 2010)TOTAL Males Females I. TOTAL person 5,903 3,020 2,883 — of which in % 100 51.2 48.8 1. BY AGE GROUP A. At pre-working age person 1,247 650 597 — of which in % 21.1 11 10.1 B. At working age. grand total person 3,563 1,996 1,567 — of which in % 60.4 33.8 26.5 a. at mobile working age person 2,332 1,259 1,073 — of which in | % 39.5 21.3 18.2 b. at non-mobile working age person 1,231 737 494 — of which in | % 20.9 12.5 8.4 C. At post-working age person 1,093 374 719 — of which in % 18.5 6.3 12.2
Villages
editApart from the town of Osiek, Gmina Osiek contains the villages and settlements of Bukowa, Długołęka, Kąty, Łęg, Lipnik, Matiaszów, Mikołajów, Mucharzew, Nakol, Niekrasów, Niekurza, Ossala, Ossala-Lesisko, Pliskowola, Strużki, Suchowola, Sworoń, Szwagrów, Trzcianka, Trzcianka-Kolonia and Tursko Wielkie.
Neighbouring gminas
editGmina Osiek is bordered by the gminas of Baranów Sandomierski, Gawłuszowice, Łoniów, Padew Narodowa, Połaniec, Rytwiany and Staszów.
References
edit- ^ a b c d e f g h i "Local Data Bank (Bank Danych Lokalnych) – Layout by NTS nomenclature (Układ wg klasyfikacji NTS)". demografia.stat.gov.pl: GUS. 10 March 2011.
- ^ "Osiek – miasto, gmina, powiat staszowski, województwo świętokrzyskie" [Osiek – urban area, commune, Staszów County, Świętokrzyskie Province, Poland]. Topographical map prepared in 1:10,000 scale. Aerial and satellite orthophotomap (in Polish). Head Office of Geodesy and Cartography, Poland, Warsaw. 2011. geoportal.gov.pl. Archived from the original on 21 December 2012. Retrieved 27 April 2011.
- ^ "Osiek – obszar wiejski, gmina, powiat staszowski, województwo świętokrzyskie" [Osiek – rural area, commune, Staszów County, Świętokrzyskie Province, Poland]. Topographical map prepared in 1:10,000 scale. Aerial and satellite orthophotomap (in Polish). Head Office of Geodesy and Cartography, Poland, Warsaw. 2011. geoportal.gov.pl. Archived from the original on 21 December 2012. Retrieved 27 April 2011.
External links
edit


