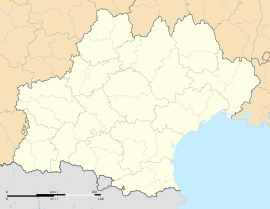
Gavarnie-Gèdre (French pronunciation: [ɡavaʁni ʒɛdʁ]; Occitan: Gavarnia e Gèdra) is a commune in the department of Hautes-Pyrénées, southwestern France. The municipality was established on 1 January 2016 by merger of the former communes of Gavarnie and Gèdre.[2]
Gavarnie-Gèdre | |
|---|---|
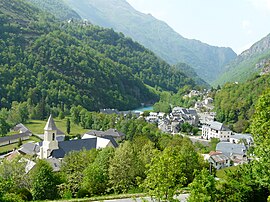
 A general view of Gèdre | |
| Coordinates: 42°47′20″N 0°01′08″E / 42.789°N 0.019°E | |
| Country | France |
| Region | Occitania |
| Department | Hautes-Pyrénées |
| Arrondissement | Argelès-Gazost |
| Canton | La Vallée des Gaves |
Area 1 | 227.08 km2 (87.68 sq mi) |
| Population (2021)[1] | 341 |
| • Density | 1.5/km2 (3.9/sq mi) |
| Time zone | UTC+01:00 (CET) |
| • Summer (DST) | UTC+02:00 (CEST) |
| INSEE/Postal code | 65192 /65120 |
| 1 French Land Register data, which excludes lakes, ponds, glaciers > 1 km2 (0.386 sq mi or 247 acres) and river estuaries. | |
Geography
editClimate
editGavarnie-Gèdre has an oceanic climate (Köppen climate classification Cfb). The average annual temperature in Gavarnie-Gèdre is 8.6 °C (47.5 °F). The average annual rainfall is 1,471.4 mm (57.93 in) with October as the wettest month. The temperatures are highest on average in August, at around 17.0 °C (62.6 °F), and lowest in February, at around 1.6 °C (34.9 °F). The highest temperature ever recorded in Gavarnie-Gèdre was 34.1 °C (93.4 °F) on 18 August 2012; the coldest temperature ever recorded was −18.1 °C (−0.6 °F) on 8 February 2012.
| Climate data for Gavarnie-Gèdre (1991−2020 normals, extremes 2007−present) | |||||||||||||
|---|---|---|---|---|---|---|---|---|---|---|---|---|---|
| Month | Jan | Feb | Mar | Apr | May | Jun | Jul | Aug | Sep | Oct | Nov | Dec | Year |
| Record high °C (°F) | 15.5 (59.9) |
19.8 (67.6) |
20.6 (69.1) |
25.0 (77.0) |
29.0 (84.2) |
32.8 (91.0) |
33.3 (91.9) |
34.1 (93.4) |
32.2 (90.0) |
25.4 (77.7) |
22.2 (72.0) |
18.6 (65.5) |
34.1 (93.4) |
| Mean daily maximum °C (°F) | 6.1 (43.0) |
6.7 (44.1) |
9.6 (49.3) |
12.5 (54.5) |
15.7 (60.3) |
19.9 (67.8) |
23.0 (73.4) |
23.6 (74.5) |
19.7 (67.5) |
15.8 (60.4) |
9.4 (48.9) |
7.2 (45.0) |
14.1 (57.4) |
| Daily mean °C (°F) | 1.6 (34.9) |
1.6 (34.9) |
4.2 (39.6) |
7.1 (44.8) |
10.0 (50.0) |
13.8 (56.8) |
16.6 (61.9) |
17.0 (62.6) |
13.4 (56.1) |
10.2 (50.4) |
4.9 (40.8) |
2.7 (36.9) |
8.6 (47.5) |
| Mean daily minimum °C (°F) | −2.9 (26.8) |
−3.4 (25.9) |
−1.2 (29.8) |
1.7 (35.1) |
4.4 (39.9) |
7.8 (46.0) |
10.1 (50.2) |
10.4 (50.7) |
7.2 (45.0) |
4.6 (40.3) |
0.5 (32.9) |
−1.8 (28.8) |
3.1 (37.6) |
| Record low °C (°F) | −16.0 (3.2) |
−18.1 (−0.6) |
−13.8 (7.2) |
−9.8 (14.4) |
−4.6 (23.7) |
−0.2 (31.6) |
1.9 (35.4) |
2.2 (36.0) |
−2.3 (27.9) |
−7.1 (19.2) |
−12.3 (9.9) |
−14.6 (5.7) |
−18.1 (−0.6) |
| Average precipitation mm (inches) | 127.4 (5.02) |
105.8 (4.17) |
116.4 (4.58) |
148.9 (5.86) |
136.8 (5.39) |
124.6 (4.91) |
96.6 (3.80) |
83.8 (3.30) |
85.6 (3.37) |
180.9 (7.12) |
168.1 (6.62) |
96.5 (3.80) |
1,471.4 (57.93) |
| Average precipitation days (≥ 1.0 mm) | 11.5 | 10.3 | 12.5 | 12.4 | 12.5 | 11.3 | 8.1 | 7.6 | 8.8 | 9.6 | 12.2 | 9.5 | 126.4 |
| Source: Météo-France[3] | |||||||||||||
Landmarks
editThe place is famed primarily for the Cirque de Gavarnie, which is a glacial valley. The southern border is on the mountains, with Aragon, Spain.[4]
In the village of Gavarnie is a small church. The church, built around the 12th Century, lies on the Camino route. The church contains a cabinet which claims to hold the skulls of a number of the Knights Templar who died whilst traveling to Compostela. The church was an influential factor in the listing of the village of Gavarnie as a UNESCO World Heritage Site.[4] The village is visited by those who ski and by HCPT Pilgrimages to Lourdes.
See also
editReferences
edit- ^ "Populations légales 2021" (in French). The National Institute of Statistics and Economic Studies. 28 December 2023.
- ^ Arrêté préfectoral 18 December 2015 (in French)
- ^ "Fiche Climatologique Statistiques 1991-2020 et records" (PDF) (in French). Météo-France. Retrieved September 11, 2022.
- ^ a b "CIRQUE DE GAVARNIE". Lourdes.


