Size of this PNG preview of this SVG file: 385 × 599 pixels. Other resolutions: 154 × 240 pixels | 308 × 480 pixels | 494 × 768 pixels | 658 × 1,024 pixels | 1,316 × 2,048 pixels | 405 × 630 pixels.
Original file (SVG file, nominally 405 × 630 pixels, file size: 139 KB)
| This is a file from the Wikimedia Commons. Information from its description page there is shown below. Commons is a freely licensed media file repository. You can help. |
Summary
| DescriptionPopulation vs area.svg |
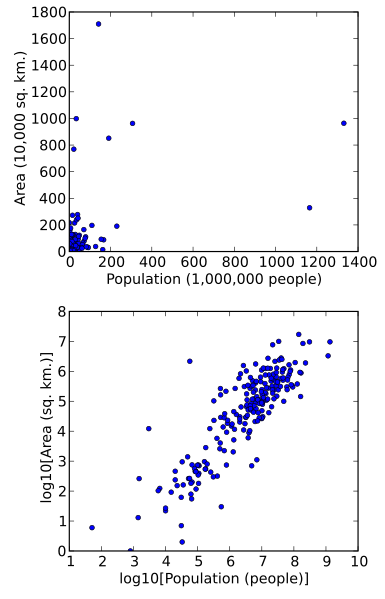
English: Scatterplot of the areas and populations of the countries of the world, on the raw and log scales. |
| Date | |
| Source | Own work |
| Author | Skbkekas |
| Other versions |
[edit]
|
| SVG development InfoField | This plot was created with Matplotlib. |
| Source code InfoField | Python codeimport numpy as np
import matplotlib.pyplot as plt
## Population data from wikipedia.
Pop = [33681000,1134000,61811,5110000,6600,3350400,13388910,52000,\
79221000,107000,1185000,40135000,9863000,19522000,15757000,\
23837000,25721000,506000,2053355,14027000,3767000,2985000,\
6316000,45828172,3476608,16517532,6349000,2719000,2845000,\
43739000,163000,57000,1475000,1500,33000,4312067,23580000,\
89300,166649000,3170000,179000,546200,5743000,4599000,21075000,\
1165040000,8629900,2067000,109000,39802000,48333000,6952000,\
178000,71517100,28150000,849000,87000,3291000,523000,172000,\
30800,2671000,65073482,9998000,5413548,9133000,29165000,6320000,\
10000,84000,4821137,15263000,20000,8935000,111000,513000,\
11204000,624000,3683000,6619000,3230100,10090000,46143700,\
791000,104000,5336330,6420000,230330000,4422000,306664000,\
9276509,88069000,23000,13010000,800,7602100,1288000,21496700,\
18498000,10631800,48697000,1400,801600,35593,1409000,28200000,\
12534000,22894000,32710000,127580000,15290000,191293104,3000,\
48841,10069000,3454000,762000,4579000,491700,67000,86000,31000,\
21906000,20000,154729000,13995000,162221000,400000,21809733,\
70495782,34895000,6163000,10000,50,10474600,62000,16922000,\
3982000,10741000,63389730,10033000,322100,7008900,5696000,\
4382100,5515287,92226600,3572700,31491578,2171000,1611000,\
98000,7719100,104000,80000,11206000,1340341,3361000,676000,\
4224000,27488000,10327800,864000,65000,88000,67000,44952732,\
8303000,33000,256000,19625000,60090400,697000,42272000,29331000,\
412600,309000,520000,56000,15000,28359313,198000,7411500,\
3761646,12935000,8356707,6732000,12523000,82062200,240000,\
15571506,38130300,5073000,5482000,30747000,5900,23906000,\
1339000,319326,2257300,10029900,9671900,7466000,109610000,\
76762112,2048900,4839400,9850000,676000,61612300,11262500,\
20238000,4432000,1950000,1331115200,141812991]
## Area data from wikipedia.
Area = [9984670,14874,78,488100,122,65300,181035,261,1104300,180,17364,\
2780400,1098581,475442,274222,238533,2149690,4033,20273,108889,\
51197,17818,89342,505992,111369,41543,406752,10991,309500,\
945087,964,2166086,267668,260,1,270467,527968,116,881912,\
28748,2831,29,120340,83600,322463,3287263,86600,30355,389,\
580367,99678,143100,549,783562,652090,18274,464,1025520,28896,\
539,61,1564100,632760,26338,49035,637657,1285216,236800,21,455,\
323802,118484,236,112622,702,266000,109886,13812,342000,56785,\
29743,48310,603500,741,747,338145,1759540,1904569,622984,\
9629091,450295,331689,151,1240192,0,110879,2040,238391,\
1246700,92090,1221037,12,9251,160,11586,329847,196722,801590,\
241038,377915,1267000,8514877,12173,1393,245857,75517,214969,\
51100,2586,199,468,6,185180,459,923768,283561,143998,5765,\
7692024,1648195,2381741,21041,26,5,78867,181,756102,8870,30528,\
513120,27750,22966,1108,71740,69700,43094,300000,33851,446550,\
824292,36125,726,41284,344,572,1284000,45228,176215,28051,10400,\
447400,163610,23200,54,442,751,1138914,27834,948,430,587041,\
301318,38394,2505813,147181,316,298,163820,264,91,912050,800,\
22072,6020,752618,83871,462840,390757,357022,12189,2724900,\
312685,117600,199951,438317,102,120538,5130,103000,64589,93028,\
208000,112492,1964375,1002000,25713,699,88361,2235,242900,\
131957,65610,56594,582000,9639688,17098242]
Pop = np.array(Pop, dtype=np.float64)
Area = np.array(Area, dtype=np.float64)
plt.clf()
plt.figure(figsize=(4.5,7))
plt.axes([0.18,0.58,0.75,0.4])
plt.plot(Pop/1e6, Area/1e4, 'o', ms=4)
plt.xlabel("Population (1,000,000 people)")
plt.ylabel("Area (10,000 sq. km.)")
plt.axes([0.18,0.08,0.75,0.4])
plt.plot(np.log(1+Pop)/np.log(10), np.log(1+Area)/np.log(10), 'o', ms=4)
plt.xlabel("log10[Population (people)]")
plt.ylabel("log10[Area (sq. km.)]")
plt.savefig("population_vs_area.png")
plt.savefig("population_vs_area.svg")
|
Licensing
I, the copyright holder of this work, hereby publish it under the following licenses:

|
Permission is granted to copy, distribute and/or modify this document under the terms of the GNU Free Documentation License, Version 1.2 or any later version published by the Free Software Foundation; with no Invariant Sections, no Front-Cover Texts, and no Back-Cover Texts. A copy of the license is included in the section entitled GNU Free Documentation License.http://www.gnu.org/copyleft/fdl.htmlGFDLGNU Free Documentation Licensetruetrue |
| This file is licensed under the Creative Commons Attribution-Share Alike 3.0 Unported license. | ||
| ||
| This licensing tag was added to this file as part of the GFDL licensing update.http://creativecommons.org/licenses/by-sa/3.0/CC BY-SA 3.0Creative Commons Attribution-Share Alike 3.0truetrue |
| Copyleft: This work of art is free; you can redistribute it and/or modify it according to terms of the Free Art License. You will find a specimen of this license on the Copyleft Attitude site as well as on other sites. http://artlibre.org/licence/lal/enFALFree Art Licensefalsetrue |
You may select the license of your choice.
Captions
Add a one-line explanation of what this file represents
Items portrayed in this file
depicts
13 June 2009
File history
Click on a date/time to view the file as it appeared at that time.
| Date/Time | Thumbnail | Dimensions | User | Comment | |
|---|---|---|---|---|---|
| current | 04:45, 14 June 2009 |  | 405 × 630 (139 KB) | Skbkekas | {{Information |Description={{en|1=Scatterplot of the areas and populations of the countries of the world, on the raw and log scales.}} |Source=Own work by uploader |Author=Skbkekas |Date=2009-06-13 |Permission= |other_versions= }} <!--{ |
File usage
The following 2 pages use this file:
Global file usage
The following other wikis use this file:
- Usage on ru.wiki.x.io
Retrieved from "https://en.wiki.x.io/wiki/File:Population_vs_area.svg"

