No higher resolution available.
NZ_opinion_polls_2014-2017-majorparties.png (778 × 487 pixels, file size: 13 KB, MIME type: image/png)
| This is a file from the Wikimedia Commons. Information from its description page there is shown below. Commons is a freely licensed media file repository. You can help. |
Summary
| Description |
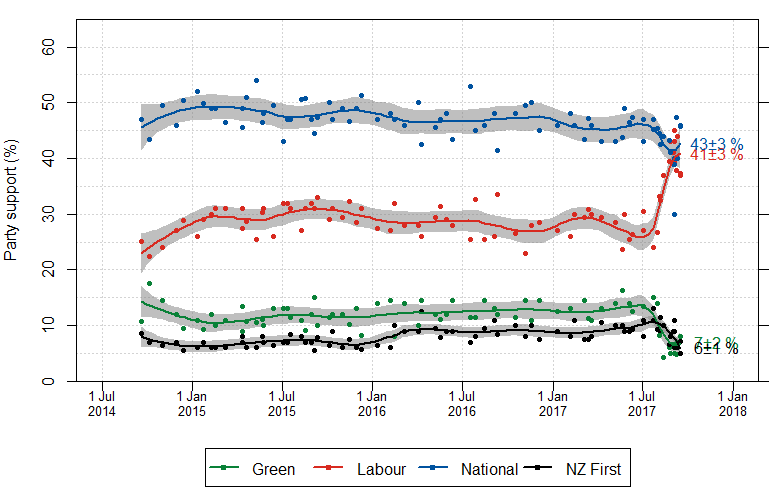
English: Graph showing support for political parties in New Zealand since the 2014 election, according to various political polls. Data is obtained from the Wikipedia page, Opinion polling for the Next New Zealand general election |
| Date | |
| Source | Own work based on very very lightly modified R Code from File:NZ_opinion_polls_2011-2014-majorparties.png |
| Author | Limegreen |

|
This file may be updated to reflect new information. If you wish to use a specific version of the file without it being overwritten, please upload the required version as a separate file. |
Figure is produced using the R statistical package, using the following code. It first reads the HTML directly from the website, then parses the data and saves the graph into your working directory. It should be able to be run directly by anyone with R.
rm(list=ls())
require(mgcv)
require(tidyverse)

#==========================================
#Parameters - specified as a list
opts <- list()
opts$major <- list(parties= c("Green","Labour","National","NZ First"),   #use precise names from Table headers
                   ylims = c(0,65),   #Vertical range
                   fname= "NZ_opinion_polls_2014-2017-majorparties.png",
                   dp=0)  #Number of decimal places to round estimates to
opts$minor <- list(parties=c("ACT","Maori","United","Mana","Con", "TOP"   #please use "Maori" for the Maori party
                   ),
                   ylims = c(0,6),   #Vertical range
                   fname = "NZ_opinion_polls_2014-2017-minorparties.png",
                   dp=1) #Number of decimal places to round estimates to

#==========================================
#Shouldn't need to edit anything below here
#==========================================

#Load the complete HTML file into memory
html <- readLines(url("https://en.wiki.x.io/wiki/Opinion_polling_for_the_New_Zealand_general_election,_2017",encoding="UTF-8"))


# html <- read_html("http://en.wiki.x.io/wiki/Opinion_polling_for_the_next_New_Zealand_general_election",encoding="UTF-8")
closeAllConnections()

#Extract the opinion poll data table
tbl.no <- 1
tbl <- html[(grep("<table.*",html)[tbl.no]):(grep("</table.*",html)[tbl.no])]

#Now split it into the rows, based on the <tr> tag
tbl.rows <- list()
open.tr <- grep("<tr",tbl)
close.tr <- grep("</tr",tbl)
for(i in 1:length(open.tr)) tbl.rows[[i]] <- tbl[open.tr[i]:close.tr[i]]

#Extract table headers
hdrs <- grep("<th",tbl,value=TRUE)
hdrs <- hdrs[1:(length(hdrs)/2 -10)]
party.names <- gsub("<.*?>","",hdrs)[-c(1:2)] %>% #nasty hack
  gsub(" ","_",.) %>% #Replace space with a _
  gsub("M.{1}ori","Maori",.) #Apologies, but the hard "a" is too hard to handle otherwise

# party.cols   <- gsub("^.*bgcolor=\"(.*?)\".*$","\\1",hdrs)[-c(1:2)]
party.cols <- c("#00529F", "#D82A20", "#098137", "#000000", "#EF4A42",
                "#FDE401", "#501557", "#00AEEF", "#770808", "#151A61")
names(party.cols) <- party.names

#Extract data rows
tbl.rows <- tbl.rows[sapply(tbl.rows,function(x) length(grep("<td",x)))>1]

###UGLY HACK
#party.names <- party.names[1:9]

#Now extract the data
survey.dat <- lapply(tbl.rows,function(x) {
  #Start by only considering where we have <td> tags
  td.tags <- x[grep("<td",x)]
  #Polling data appears in columns other than first two
  dat     <- td.tags[-c(1,2)]
  #Now strip the data and covert to numeric format
  dat     <- gsub("<td>|</td>|<b>|</b>|<td style=|background:#[0-9A-Z]{6}","",dat)
  dat     <- gsub("\"", "", dat)
  dat     <- gsub("%","",dat)
  dat     <- gsub("-","0",dat)
  dat     <- gsub("<|>","",dat)
  dat     <- as.numeric(dat)
  if(length(dat)!=length(party.names)) {
    stop(sprintf("Survey data is not defined properly: %s",td.tags[1]))
  }
  names(dat) <- party.names
  #Getting the date strings is a little harder. Start by tidying up the dates
  date.str <- td.tags[2]                        #Dates are in the second column
  date.str <- gsub("<sup.*</sup>","",date.str)   #Throw out anything between superscript tags, as its an reference to the source
  date.str <- gsub("<td>|</td>","",date.str)  #Throw out any tags
  #Get numeric parts of string
  digits.str <- gsub("[^0123456789]"," ",date.str)
  digits.str <- gsub("^ +","",digits.str)    #Drop leading whitespace
  digits     <- strsplit(digits.str," +")[[1]]
  yrs        <- grep("[0-9]{4}",digits,value=TRUE)
  days       <- digits[!digits%in%yrs]
  #Get months
  month.str <- gsub("[^A-Z,a-z]"," ",date.str)
  month.str <- gsub("^ +","",month.str)        #Drop leading whitespace
  mnths     <- strsplit(month.str," +",month.str)[[1]]
  #Now paste together to make standardised date strings
  days  <- rep(days,length.out=2)
  mnths <- rep(mnths,length.out=2)
  yrs <- rep(yrs,length.out=2)
  dates.std <- paste(days,mnths,yrs)
  #And finally the survey time
  survey.time <- mean(as.POSIXct(strptime(dates.std,format="%d %B %Y")))
  #Get the name of the survey company too
  survey.comp <- td.tags[1]
  survey.comp <- gsub("<sup.*</sup>","",survey.comp)
  survey.comp <- gsub("<td>|</td>","",survey.comp)
  survey.comp <- gsub("<U+2013>","-",survey.comp,fixed=TRUE)
  survey.comp <- gsub("(?U)<.*>","",survey.comp,perl=TRUE)
  survey.comp <- gsub("^ +| +$","",survey.comp)
  survey.comp <- gsub("-+"," ",survey.comp)

  #And now return results
  return(data.frame(Company=survey.comp,Date=survey.time,date.str,t(dat)))
})

#Combine results
surveys <- do.call(rbind,survey.dat)

##ugly date fix
surveys[26, 2] <- "2015-10-06 00:00:00"
surveys[29, 2] <- "2015-11-15 00:00:00"

#Ugly fix to remove Opportunities party while not enough data
# surveys <- select(surveys, -TOP)


#==========================================
#Now generate each plot
#==========================================


smoothers  <- list()
for(opt in opts) {

  #Restrict data to selected parties
  selected.parties <- gsub(" ","_",sort(opt$parties))
  selected.cols <- party.cols[selected.parties]
  plt.dat   <- surveys[,c("Company","Date",selected.parties)]
  plt.dat <- subset(plt.dat,!is.na(surveys$Date))
  plt.dat <- plt.dat[order(plt.dat$Date),]
  plt.dat$date.num  <- as.double(plt.dat$Date)
  plt.dat <- subset(plt.dat,Company!="2008 election result")
  plt.dat$Company <- factor(plt.dat$Company)

  #Setup plot
  ticks <- ISOdate(c(rep(2014,1),rep(2015,2),rep(2016,2),rep(2017,2),2018),c(rep(c(7,1),4)),1)
  xlims <- range(c(ISOdate(2014,11,1),ticks))
  png(opt$fname,width=778,height=487,pointsize=16)
  par(mar=c(5.5,4,1,1))
  matplot(plt.dat$date.num,plt.dat[,selected.parties],pch=NA,xlim=xlims,ylab="Party support (%)",
          xlab="",col=selected.cols,xaxt="n",ylim=opt$ylims,yaxs="i")
  abline(h=seq(0,95,by=5),col="lightgrey",lty=3)
  abline(v=as.double(ticks),col="lightgrey",lty=3)
  box()
  axis(1,at=as.double(ticks),labels=format(ticks,format="1 %b\n%Y"),cex.axis=0.8)
  axis(4,at=axTicks(4),labels=rep("",length(axTicks(4))))

  smoothed <- list()
  predict.x <- seq(min(surveys$Date),max(surveys$Date),length.out=100)
  for(i in 1:length(selected.parties)) {
    smoother <- loess(surveys[,selected.parties[i]] ~ as.numeric(surveys[,"Date"]),span=0.35)
    smoothed[[i]] <- predict(smoother,newdata=predict.x,se=TRUE)
    polygon(c(predict.x,rev(predict.x)),
            c(smoothed[[i]]$fit+smoothed[[i]]$se.fit*1.96,rev(smoothed[[i]]$fit-smoothed[[i]]$se.fit*1.96)),
            col=rgb(0.5,0.5,0.5,0.5),border=NA)
  }
  names(smoothed) <- selected.parties
  #Then add the data points
  matpoints(surveys$Date, surveys[,selected.parties],pch=20,col=selected.cols)
  #And finally the smoothers themselves
  for(i in 1:length(selected.parties)) {
    lines(predict.x,smoothed[[i]]$fit,col=selected.cols[i],lwd=2)
  }

  # #Then add the data points
  # matpoints(plt.dat$date.num,plt.dat[,selected.parties],pch=20,col=selected.cols)
  # #And finally the smoothers themselves
  # for(n in selected.parties) {
  #   lines(smoothed.l[[n]]$date,smoothed.l[[n]]$fit,col=selected.cols[n],lwd=2)
  # }

  n.parties <- length(selected.parties)
  legend(grconvertX(0.5,"npc"),grconvertY(0.0,"ndc"),xjust=0.5,yjust=0,
         legend=gsub("_"," ",selected.parties), col=selected.cols,
         pch=20,bg="white",lwd=2,
         ncol=ifelse(n.parties>4,ceiling(n.parties/2),n.parties),xpd=NA)
  #Add best estimates
  fmt.str <- sprintf("%%2.%if\261%%1.%if %%%%",opt$dp,opt$dp)
  for(n in names(smoothed)) {
    lbl <- sprintf(fmt.str,
                   round(rev(smoothed[[n]]$fit)[1],opt$dp),
                   round(1.96*rev(smoothed[[n]]$se.fit)[1],opt$dp))
    text(rev(plt.dat$date.num)[1],rev(smoothed[[n]]$fit)[1],
         labels=lbl,pos=4,col=selected.cols[n],xpd=NA)
  }
  dev.off()
}

#==========================================
#Finished!
#==========================================

cat("Complete.\n")
Licensing
I, the copyright holder of this work, hereby publish it under the following license:
This file is licensed under the Creative Commons Attribution-Share Alike 4.0 International license.
- You are free:
- to share – to copy, distribute and transmit the work
- to remix – to adapt the work
- Under the following conditions:
- attribution – You must give appropriate credit, provide a link to the license, and indicate if changes were made. You may do so in any reasonable manner, but not in any way that suggests the licensor endorses you or your use.
- share alike – If you remix, transform, or build upon the material, you must distribute your contributions under the same or compatible license as the original.
Any autopatrolled user can overwrite this file from the same source. Please ensure that overwrites comply with the guideline.
File history
Click on a date/time to view the file as it appeared at that time.
| Date/Time | Thumbnail | Dimensions | User | Comment | |
|---|---|---|---|---|---|
| current | 21:06, 21 September 2017 | | 778 × 487 (13 KB) | Limegreen | add latest polls, and also changed span to .24 to make the curve more responsive to recent volatility |
| 00:08, 17 September 2017 |  | 778 × 487 (12 KB) | Limegreen | some new polls | |
| 09:24, 14 September 2017 |  | 778 × 487 (12 KB) | Limegreen | add colmar brunton | |
| 08:50, 12 September 2017 |  | 778 × 487 (12 KB) | Limegreen | add latest newshub | |
| 01:30, 11 September 2017 |  | 778 × 487 (12 KB) | Limegreen | Switched to loess (span = .35) smoother, and added recent polls | |
| 13:46, 28 August 2017 |  | 778 × 487 (11 KB) | Limegreen | add new polls | |
| 11:48, 11 August 2017 |  | 778 × 487 (11 KB) | Limegreen | add new polls | |
| 22:23, 31 July 2017 |  | 778 × 487 (11 KB) | Limegreen | Add Newshub Reid Research | |
| 22:56, 30 July 2017 |  | 778 × 487 (11 KB) | Limegreen | add new colmar brunton poll. Also set k to 5 so that it matches the minor party figure. | |
| 10:36, 15 July 2017 |  | 778 × 487 (11 KB) | Limegreen | add 2 new polls |
File usage
The following pages on the English Wikipedia use this file (pages on other projects are not listed):
Global file usage
The following other wikis use this file:
- Usage on de.wiki.x.io
- Usage on fr.wiki.x.io
- Usage on ru.wiki.x.io
- Usage on simple.wiki.x.io