
Size of this preview: 800 × 547 pixels. Other resolutions: 320 × 219 pixels | 640 × 438 pixels | 911 × 623 pixels.
Original file (911 × 623 pixels, file size: 27 KB, MIME type: image/png)
Summary
edit
Muscle force-velocity relationship curve. Also displayed muscle power curve as a function of velocity; force and velocity for maximum power are also displayed. The data are derived from the 1988, Edman paper containing graphs of in-vitro measurements.
Licensing
edit
| This image is ineligible for copyright and therefore is in the public domain, because it consists entirely of information that is common property and contains no original authorship. |
 | This file is a candidate to be copied to Wikimedia Commons.
Any user may perform this transfer; refer to Wikipedia:Moving files to Commons for details. If this file has problems with attribution, copyright, or is otherwise ineligible for Commons, then remove this tag and DO NOT transfer it; repeat violators may be blocked from editing. Other Instructions
| ||
| |||
File history
Click on a date/time to view the file as it appeared at that time.
| Date/Time | Thumbnail | Dimensions | User | Comment | |
|---|---|---|---|---|---|
| current | 16:00, 15 March 2011 | | 911 × 623 (27 KB) | Gciriani (talk | contribs) | == Summary == Muscle force-velocity relationship curve. Also displayed muscle power curve as a function of velocity; force and velocity for maximum power are also displayed. The data are derived from the 1988, Edman paper containing graphs of in-vitro mea |
| 02:57, 14 March 2011 |  | 911 × 623 (26 KB) | Gciriani (talk | contribs) | This curve was drawn with MS Excel from data published on page 315 of: Edman KA. Double-hyperbolic force-velocity relation in frog muscle fibres. J Physiol. 1988;404:301-321. Retrieved from http://www.ncbi.nlm.nih.gov/pmc/articles/PMC1190827/?page=15 { | |
| 02:40, 10 January 2011 | 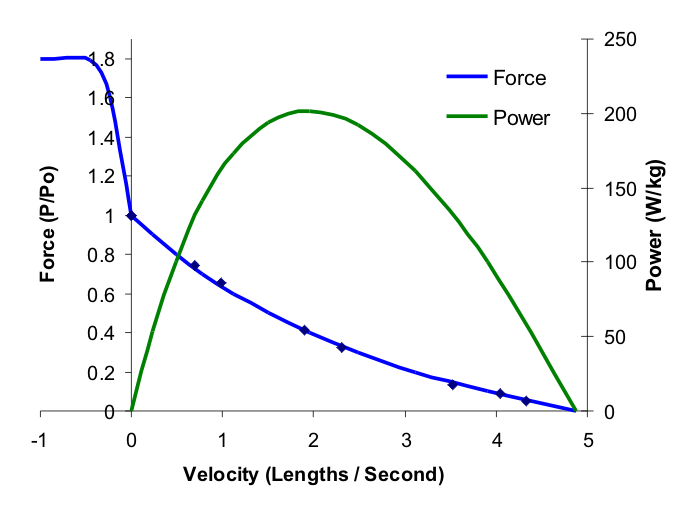 | 685 × 506 (46 KB) | HCA (talk | contribs) | New FV graph, including eccentric behavior and 'limit' at 1.8 Po. From in vitro testing of a Bufo marinus gracilis major at 22C. | |
| 17:52, 7 January 2011 | 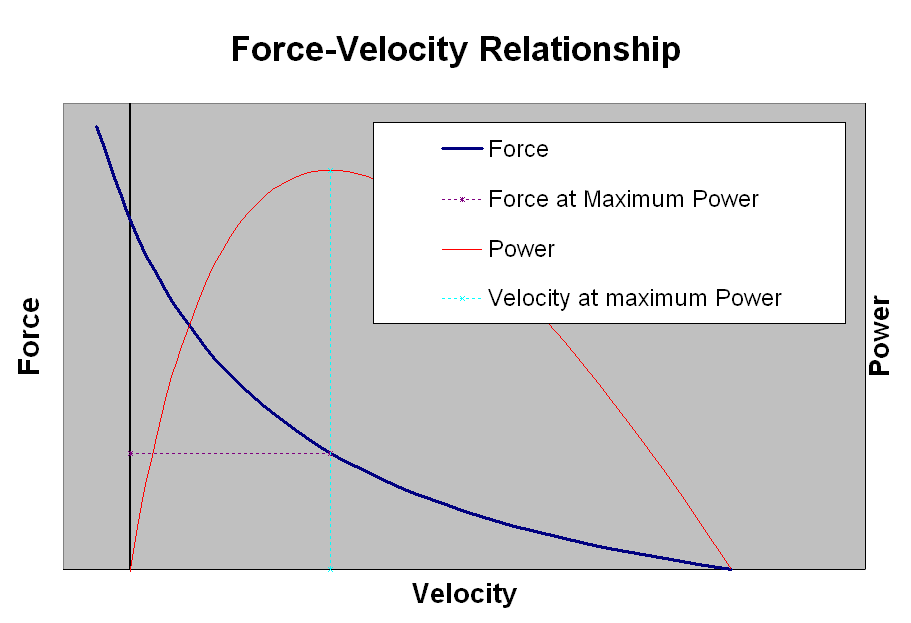 | 911 × 623 (26 KB) | Gciriani (talk | contribs) | (Muscle force-velocity relationship curve. Also displayed muscle power curve as a function of velocity; force and velocity for maximum power are also displayed.) Created with Excel using hyperbola formula. | |
| 17:49, 7 January 2011 |  | 911 × 623 (21 KB) | Gciriani (talk | contribs) | ||
| 17:42, 7 January 2011 | 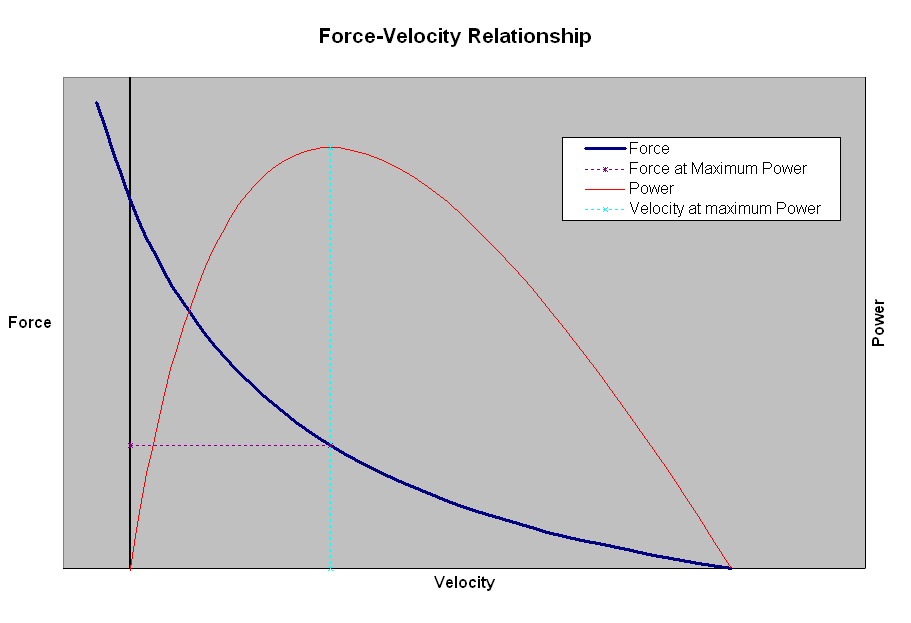 | 911 × 623 (21 KB) | Gciriani (talk | contribs) | Muscle force-velocity relationship curve. Also displayed muscle power curve as a function of velocity; force and velocity for maximum power are also displayed. |
You cannot overwrite this file.
File usage
The following page uses this file: