
Size of this PNG preview of this SVG file: 576 × 432 pixels. Other resolutions: 320 × 240 pixels | 640 × 480 pixels | 1,024 × 768 pixels | 1,280 × 960 pixels | 2,560 × 1,920 pixels.
Original file (SVG file, nominally 576 × 432 pixels, file size: 16 KB)
| This is a file from the Wikimedia Commons. Information from its description page there is shown below. Commons is a freely licensed media file repository. You can help. |
Summary
| Description |
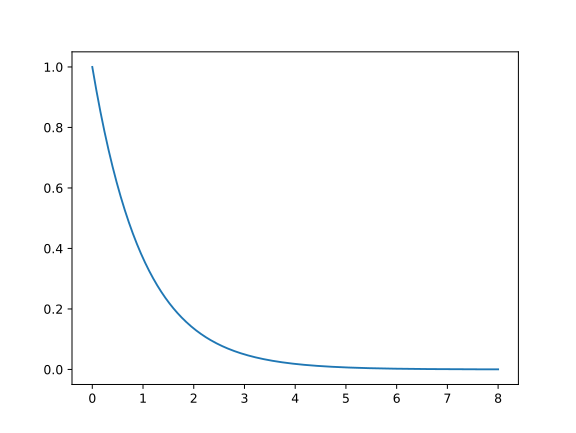
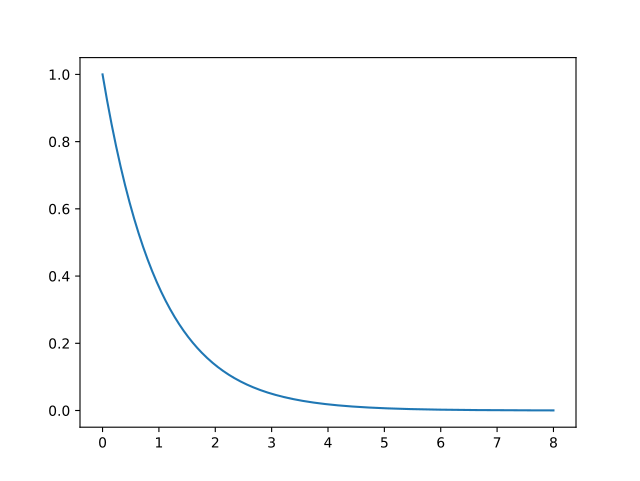
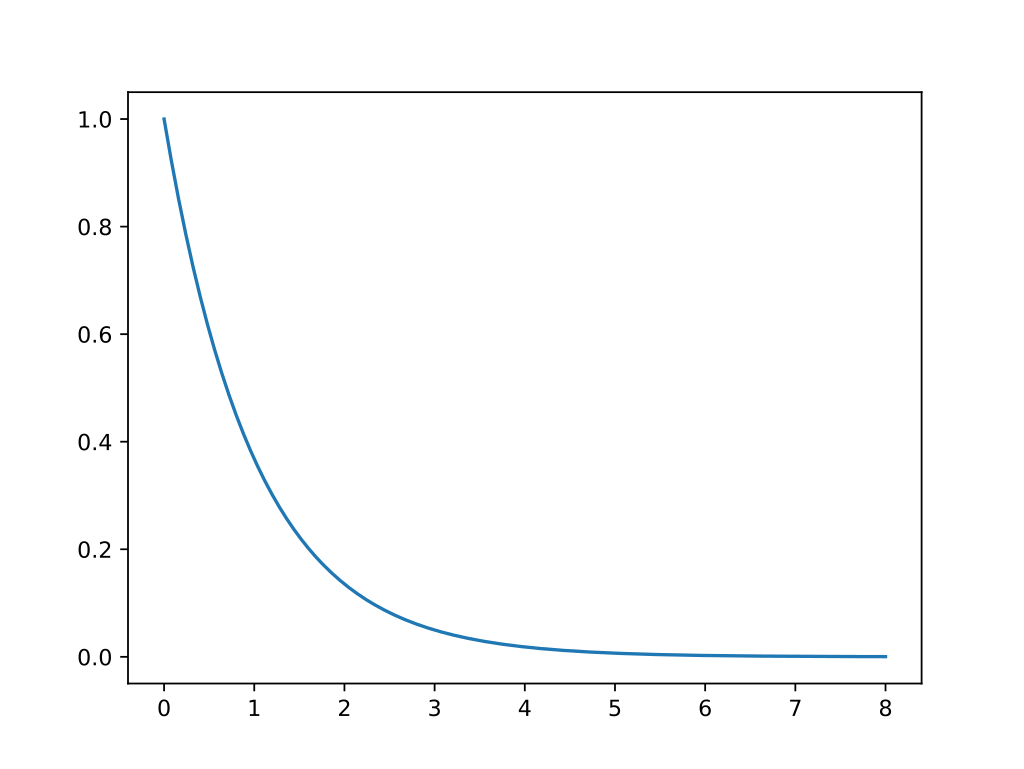
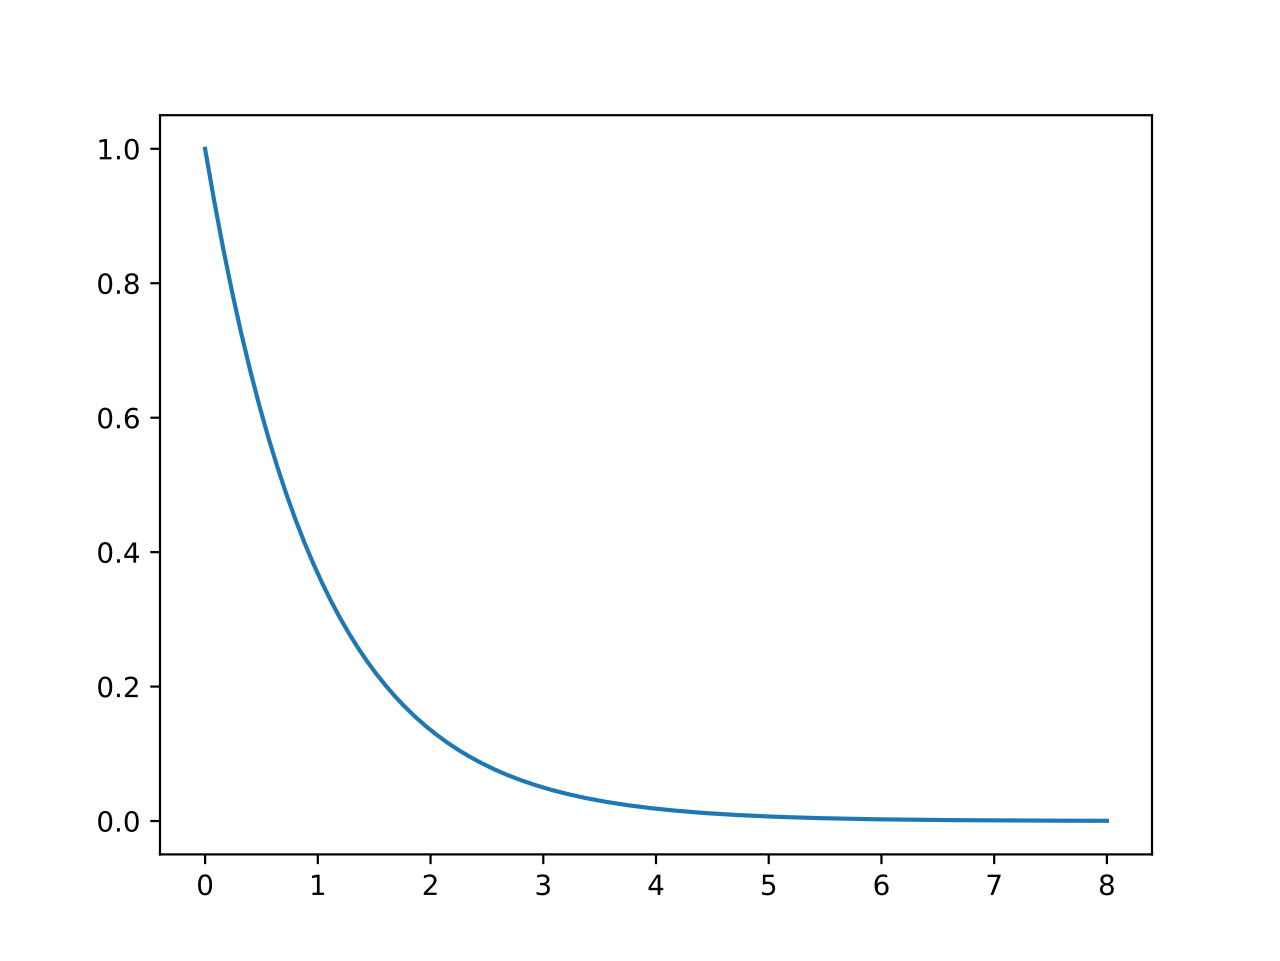
English: An example line plot of an exponential function made with matplotlib version 3 |
| Date | |
| Source | Own work |
| Author | Geek3 |
| SVG development | This plot was created with Matplotlib. |
| Source code | Python codeimport matplotlib.pyplot as plt
import numpy as np
a = np.linspace(0, 8, 501)
b = np.exp(-a)
plt.plot(a, b)
plt.savefig("Matplotlib3 lineplot.svg")
|
Licensing
I, the copyright holder of this work, hereby publish it under the following license:
This file is licensed under the Creative Commons Attribution-Share Alike 4.0 International license.
- You are free:
- to share – to copy, distribute and transmit the work
- to remix – to adapt the work
- Under the following conditions:
- attribution – You must give appropriate credit, provide a link to the license, and indicate if changes were made. You may do so in any reasonable manner, but not in any way that suggests the licensor endorses you or your use.
- share alike – If you remix, transform, or build upon the material, you must distribute your contributions under the same or compatible license as the original.
File history
Click on a date/time to view the file as it appeared at that time.
| Date/Time | Thumbnail | Dimensions | User | Comment | |
|---|---|---|---|---|---|
| current | 12:24, 17 November 2020 | | 576 × 432 (16 KB) | Geek3 | Uploaded own work with UploadWizard |
File usage
The following pages on the English Wikipedia use this file (pages on other projects are not listed):
Global file usage
The following other wikis use this file:
- Usage on de.wiki.x.io