Size of this PNG preview of this SVG file: 500 × 500 pixels. Other resolutions: 240 × 240 pixels | 480 × 480 pixels | 768 × 768 pixels | 1,024 × 1,024 pixels | 2,048 × 2,048 pixels.
Original file (SVG file, nominally 500 × 500 pixels, file size: 2 KB)
| This image was selected as picture of the month on the Mathematics Portal for August 2012. |
File history
Click on a date/time to view the file as it appeared at that time.
| Date/Time | Thumbnail | Dimensions | User | Comment | |
|---|---|---|---|---|---|
| current | 18:00, 6 March 2021 |  | 500 × 500 (2 KB) | Nyq | decapitalized common nouns |
| 16:52, 20 March 2016 |  | 500 × 500 (2 KB) | Wylve | Fixed CSS | |
| 16:51, 20 March 2016 |  | 500 × 500 (2 KB) | Wylve | Reduce tracing artifacts | |
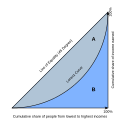
| 15:18, 24 June 2009 |  | 500 × 500 (7 KB) | Reidpath | {{Information |Description={{en|1=Gini coefficient diagram, based on the version by Bluemoose/BenFrantzDale. You can think of the horizontal axis as percent of people and the vertical axis as the percent of income those people receive. Therefore the Loren |
File usage
The following 10 pages use this file:
- Gini coefficient
- Lorenz curve
- Poverty
- User:Lexsta/sandbox
- Wikipedia:Reference desk/Archives/Humanities/2010 December 18
- Wikipedia:Village pump (technical)/Archive 106
- Portal:Mathematics/Featured picture/2012 08
- Portal:Mathematics/Featured picture archive
- Portal:Mathematics/Selected picture
- Portal:Mathematics/Selected picture/11
Global file usage
The following other wikis use this file:
- Usage on af.wiki.x.io
- Usage on ar.wiki.x.io
- Usage on bh.wiki.x.io
- Usage on bn.wiki.x.io
- Usage on et.wiki.x.io
- Usage on fa.wiki.x.io
- Usage on he.wiki.x.io
- Usage on it.wiki.x.io
- Usage on ja.wiki.x.io
- Usage on km.wiki.x.io
- Usage on la.wiki.x.io
- Usage on ms.wiki.x.io
- Usage on nl.wiki.x.io
- Usage on ro.wiki.x.io
- Usage on si.wiki.x.io
- Usage on sq.wiki.x.io
- Usage on sr.wiki.x.io
- Usage on te.wiki.x.io
- Usage on ur.wiki.x.io