File:Bayesian-gaussian-mixture.svg

Original file (SVG file, nominally 232 × 219 pixels, file size: 31 KB)

Summary

Description
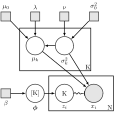
English: Plate diagram of graphical Bayesian Gaussian mixture model.

Created using the following LaTeX, TikZ:

Source Code
\documentclass{article}
\usepackage{tikz,amsmath}
%\usepackage{siunitx}
\usetikzlibrary{arrows,snakes,backgrounds,patterns,matrix,shapes,fit,calc,shadows,plotmarks}
\usepackage[graphics,tightpage,active]{preview}
\PreviewEnvironment{tikzpicture}
\PreviewEnvironment{equation}
\PreviewEnvironment{equation*}
\newlength{\imagewidth}
\newlength{\imagescale}
\pagestyle{empty}
\thispagestyle{empty}

\usepackage{standalone}

\begin{document}

\begin{tikzpicture}
\tikzstyle{main}=[circle, minimum size = 10mm, thick, draw =black!80, node distance = 16mm]
\tikzstyle{hyparam}=[rectangle, minimum size = 5mm, thick, draw =black!80, fill = black!10, node distance = 16mm]
\tikzstyle{param}=[rectangle, minimum size = 5mm, thick, draw =black!80, node distance = 16mm]
\tikzstyle{connect}=[-latex, thick]
\tikzstyle{selector}=[-latex, -|, snake=snake,segment amplitude=.4mm,segment length=2mm,line after snake=1mm, thick]
\tikzstyle{shortconnect}=[-latex, thin]
\tikzstyle{box}=[rectangle, draw=black!100]
\tikzstyle{switch}=[circle, minimum size = 1mm, fill = black!100, draw=black!100]
  \node[hyparam] (beta) [label=below:$\beta$] { };
  \node[main] (phi) [right of=beta,label=below:$\boldsymbol\phi$] {[K]};
  \node[main] (z) [right of=phi,label=below:$z_i$] {K};
  \node[main] (mu) [above of=phi,yshift=10mm, label=below:$\mu_k$] { };
  \node[main, fill = black!10] (x) [right of= z,label=below:$x_i$] { };
  \node[main] (sigma) [above of=z,yshift=10mm, label=below:$\sigma_k^2$] { };
  \node[hyparam] (nu) [above of=sigma, label=$\nu$] { };
  \node[hyparam] (sigma0) [right of=nu, label=$\sigma_0^2$] { };
  \node[hyparam] (lambda) [above of=mu, label=$\lambda$] { };
  \node[hyparam] (mu0) [left of=lambda, label=$\mu_0$] { };
  \path (beta) edge [connect] (phi)
        (phi) edge [connect] (z)
        (z) edge [selector] (x)
        (mu) edge [connect] (x)
        (sigma) edge [connect] (mu)
        (sigma) edge [connect] (x)
        (nu) edge [connect] (sigma)
        (sigma0) edge [connect] (sigma)
        (lambda) edge [connect] (mu)
        (mu0) edge [connect] (mu);
  \node[rectangle, inner sep=0mm, fit= (z) (x),label=below right:N, xshift=9mm] {};
  \node[rectangle, inner sep=4.4mm,draw=black!100, fit= (z) (x), xshift=1mm] {};
  \node[rectangle, inner sep=2mm, fit= (mu) (sigma),label=below right:K, yshift=-2mm, xshift=11mm] {};
  \node[rectangle, inner sep=6.4mm,draw=black!100, fit= (mu) (sigma), yshift=-2mm, xshift=3mm] {};
\end{tikzpicture}

\end{document}
Date
Source Created using LaTeX, TikZ
Author Benwing

Licensing

I, the copyright holder of this work, hereby publish it under the following licenses:
GNU head Permission is granted to copy, distribute and/or modify this document under the terms of the GNU Free Documentation License, Version 1.2 or any later version published by the Free Software Foundation; with no Invariant Sections, no Front-Cover Texts, and no Back-Cover Texts. A copy of the license is included in the section entitled GNU Free Documentation License.
w:en:Creative Commons
attribution
This file is licensed under the Creative Commons Attribution 3.0 Unported license.
You are free:
  • to share – to copy, distribute and transmit the work
  • to remix – to adapt the work
Under the following conditions:
  • attribution – You must give appropriate credit, provide a link to the license, and indicate if changes were made. You may do so in any reasonable manner, but not in any way that suggests the licensor endorses you or your use.
Copyright © The author

Redistribution and use in source and binary forms, with or without modification, are permitted provided that the following conditions are met:

  1. Redistributions of source code must retain the above copyright notice, this list of conditions and the following disclaimer.
  2. Redistributions in binary form must reproduce the above copyright notice, this list of conditions and the following disclaimer in the documentation and/or other materials provided with the distribution.
  3. Neither the name of The author nor the names of its contributors may be used to endorse or promote products derived from this software without specific prior written permission.

This software is provided by The author and contributors "as is" and any express or implied warranties, including, but not limited to, the implied warranties of merchantability and fitness for a particular purpose are disclaimed. In no event shall The author and contributors be liable for any direct, indirect, incidental, special, exemplary, or consequential damages (including, but not limited to, procurement of substitute goods or services; loss of use, data, or profits; or business interruption) however caused and on any theory of liability, whether in contract, strict liability, or tort (including negligence or otherwise) arising in any way out of the use of this software, even if advised of the possibility of such damage.

You may select the license of your choice.

Captions

Add a one-line explanation of what this file represents

Items portrayed in this file

depicts

1 April 2012

image/svg+xml

62038f4551d2019063e1bbea7973d2b301d9b7b6

31,883 byte

219 pixel

232 pixel

File history

Click on a date/time to view the file as it appeared at that time.

Date/TimeThumbnailDimensionsUserComment
current09:38, 2 April 2012Thumbnail for version as of 09:38, 2 April 2012232 × 219 (31 KB)Benwinguse newer format for categorical and switching nodes
05:10, 2 April 2012Thumbnail for version as of 05:10, 2 April 2012232 × 219 (30 KB)Benwing== {{int:filedesc}} == {{Information |description = {{en|1=Plate diagram of graphical Bayesian Gaussian mixture model. Created using the following LaTeX, TikZ: {{cot|Source Code}} <source lang="tex"> \documentclass{article} \usepackage{tikz,amsmath} %\...
04:04, 2 April 2012Thumbnail for version as of 04:04, 2 April 2012232 × 219 (29 KB)Benwing== {{int:filedesc}} == {{Information |description = {{en|1=Plate diagram of graphical Bayesian Gaussian mixture model. Created using the following LaTeX, TikZ: {{cot|Source Code}} <source lang="tex"> \documentclass{article} \usepackage{tikz,amsmath} %\...

The following page uses this file:

Global file usage

The following other wikis use this file: