Size of this preview: 800 × 495 pixels. Other resolutions: 320 × 198 pixels | 640 × 396 pixels | 1,024 × 633 pixels.
Original file (1,024 × 633 pixels, file size: 650 KB, MIME type: image/png)
| This is a file from the Wikimedia Commons. Information from its description page there is shown below. Commons is a freely licensed media file repository. You can help. |
| Description |
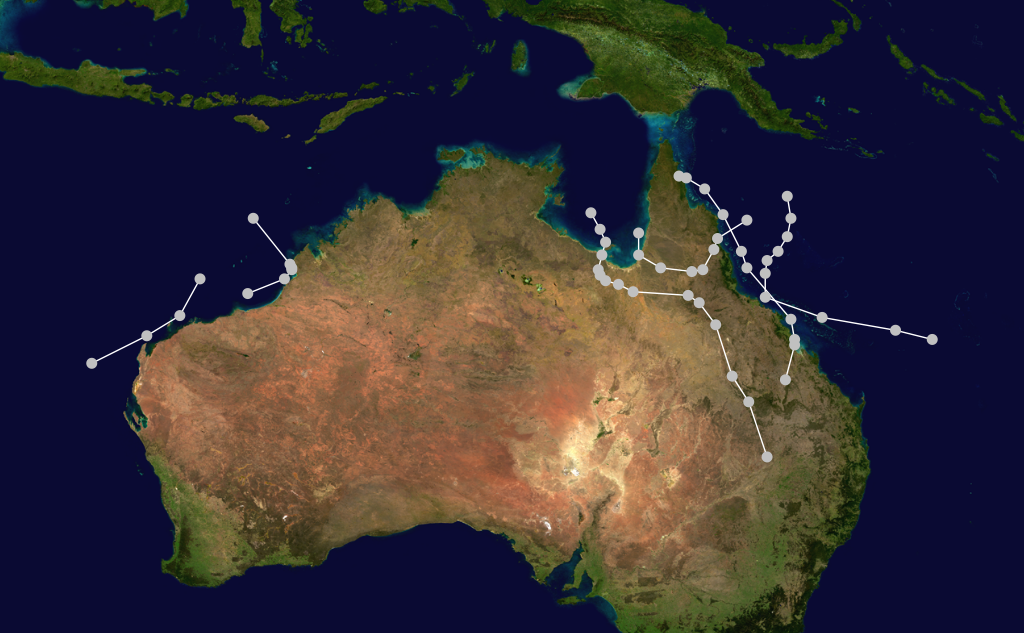
English: This map shows the tracks of all tropical cyclones in the 1910–11 Australian region cyclone season. The points show the location of each storm at 6-hour intervals. The colour represents the storm's maximum sustained wind speeds as classified in the Saffir-Simpson Hurricane Scale (see below), and the shape of the data points represent the type of the storm.
Tropical depression (≤38 mph, ≤62 km/h)
Tropical storm (39–73 mph, 63–118 km/h)
Category 1 (74–95 mph, 119–153 km/h)
Category 2 (96–110 mph, 154–177 km/h)
Category 3 (111–129 mph, 178–208 km/h)
Category 4 (130–156 mph, 209–251 km/h)
Category 5 (≥157 mph, ≥252 km/h)
Unknown
Storm type |
| Source | Created using Wikipedia:WikiProject Tropical cyclones/Tracks. The background image is from NASA [1]. The tracking data from the International Best Track Archive for Climate Stewardship's Database Version 3 Revision 4. |
| Author | Syntheticalconnections |
| This work has been released into the public domain by its author, Syntheticalconnections. This applies worldwide. In some countries this may not be legally possible; if so: Syntheticalconnections grants anyone the right to use this work for any purpose, without any conditions, unless such conditions are required by law. |
Any autoconfirmed user can overwrite this file from the same source. Please ensure that overwrites comply with the guideline.
File history
Click on a date/time to view the file as it appeared at that time.
| Date/Time | Thumbnail | Dimensions | User | Comment | |
|---|---|---|---|---|---|
| current | 23:11, 4 November 2010 | | 1,024 × 633 (650 KB) | Syntheticalconnections | {{Information |Description={{en|1={{Information |Description={{en|Track map of all storms in the 1911 Australian region cyclone season The points show the location of the storm at 6-hour intervals |
File usage
The following pages on the English Wikipedia use this file (pages on other projects are not listed):