
Size of this preview: 800 × 494 pixels. Other resolutions: 320 × 198 pixels | 640 × 396 pixels | 1,024 × 633 pixels | 1,280 × 791 pixels | 3,000 × 1,854 pixels.
Original file (3,000 × 1,854 pixels, file size: 598 KB, MIME type: image/png)
| This is a file from the Wikimedia Commons. Information from its description page there is shown below. Commons is a freely licensed media file repository. You can help. |
Summary
| Description |
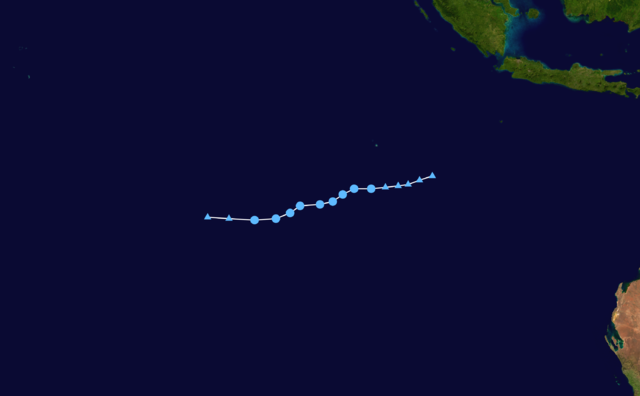
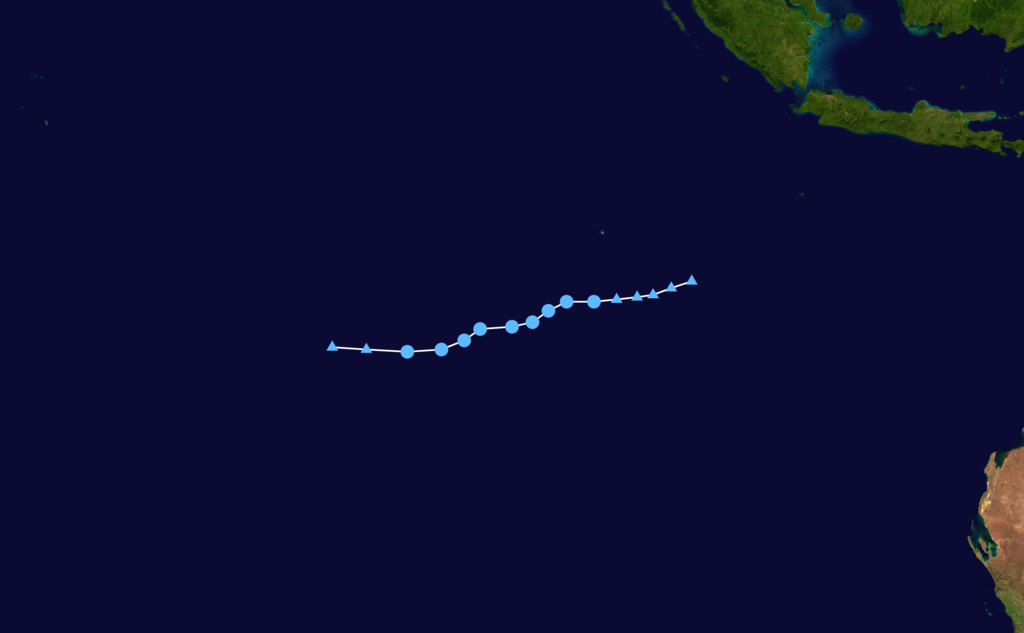
English: Track map of Tropical Low 12U of the 2015–16 Australian region cyclone season. The points show the location of the storm at 6-hour intervals. The colour represents the storm's maximum sustained wind speeds as classified in the Saffir-Simpson Hurricane Scale (see below), and the shape of the data points represent the nature of the storm, according to the legend below.
Tropical depression (≤38 mph, ≤62 km/h)
Tropical storm (39–73 mph, 63–118 km/h)
Category 1 (74–95 mph, 119–153 km/h)
Category 2 (96–110 mph, 154–177 km/h)
Category 3 (111–129 mph, 178–208 km/h)
Category 4 (130–156 mph, 209–251 km/h)
Category 5 (≥157 mph, ≥252 km/h)
Unknown
Storm type |
| Date | |
| Source | Created using Wikipedia:WikiProject Tropical cyclones/Tracks. The background image is from NASA. Tracking data is from NOAA |
| Author | User:Cyclonebiskit |
Licensing
| I, the copyright holder of this work, release this work into the public domain. This applies worldwide. In some countries this may not be legally possible; if so: I grant anyone the right to use this work for any purpose, without any conditions, unless such conditions are required by law. |
File history
Click on a date/time to view the file as it appeared at that time.
| Date/Time | Thumbnail | Dimensions | User | Comment | |
|---|---|---|---|---|---|
| current | 03:57, 7 March 2016 | | 3,000 × 1,854 (598 KB) | Cyclonebiskit | =={{int:filedesc}}== {{Information |Description = {{en|Track map of Tropical Low 12U of the 2015–16 Australian region cyclone season. T... |
File usage
The following page uses this file:
Global file usage
The following other wikis use this file:
- Usage on pt.wiki.x.io
- Usage on th.wiki.x.io
- Usage on zh.wiki.x.io