This article needs additional citations for verification. (December 2016) |
Electrooculography (EOG) is a technique for measuring the corneo-retinal standing potential that exists between the front and the back of the human eye. The resulting signal is called the electrooculogram. Primary applications are in ophthalmological diagnosis and in recording eye movements. Unlike the electroretinogram, the EOG does not measure response to individual visual stimuli.[citation needed]
| Electrooculography | |
|---|---|
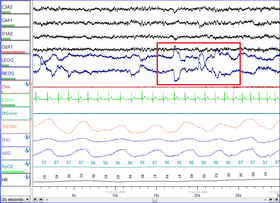
 Electrooculograms for the left eye (LEOG) and the right eye (REOG) for the period of REM sleep. | |
| ICD-9-CM | 95.22 |
| MeSH | D004585 |
To measure eye movement, pairs of electrodes are typically placed either above and below the eye or to the left and right of the eye. If the eye moves from center position toward one of the two electrodes, this electrode "sees" the positive side of the retina and the opposite electrode "sees" the negative side of the retina. Consequently, a potential difference occurs between the electrodes. Assuming that the resting potential is constant, the recorded potential is a measure of the eye's position.
In 1951 Elwin Marg described and named electrooculogram for a technique of measuring the resting potential of the retina in the human eye.[1]
Principle
editThe eye acts as a dipole in which the anterior pole is positive and the posterior pole is negative.
- Left gaze: the cornea approaches the electrode near the outer canthus of the left eye, resulting in a negative-trending change in the recorded potential difference.
- Right gaze: the cornea approaches the electrode near the inner canthus of the left eye, resulting in a positive-trending change in the recorded potential difference.
Ophthalmological diagnosis
editThe EOG is used to assess the function of the pigment epithelium. During dark adaptation, resting potential decreases slightly and reaches a minimum ("dark trough") after several minutes. When light is switched on, a substantial increase of the resting potential occurs ("light peak"), which drops off after a few minutes when the retina adapts to the light. The ratio of the voltages (i.e. light peak divided by dark trough) is known as the Arden ratio. In practice, the measurement is similar to eye movement recordings (see above). The patient is asked to switch eye position repeatedly between two points (alternating looking from center to the left and from center to the right). Since these positions are constant, a change in the recorded potential originates from a change in the resting potential.[citation needed]
See also
editReferences
edit- ^ Marg, Elwin (1951). "Development of electro-oculography; standing potential of the eye in registration of eye movement". AMA Arch Ophthalmol. 45 (2): 169–185. doi:10.1001/archopht.1951.01700010174006. PMID 14799014.
- Brown, M., Marmor, M. and Vaegan, ISCEV Standard for Clinical Electro-oculography (EOG) (2006), in: Documenta Ophthalmologica, 113:3(205–212)
- Bulling, A. et al.: It's in Your Eyes - Towards Context-Awareness and Mobile HCI Using Wearable EOG Goggles, Proc. of the 10th International Conference on Ubiquitous Computing (UbiComp 2008), pages 84–93, ACM Press, 2008
- Bulling, A. et al.: Robust Recognition of Reading Activity in Transit Using Wearable Electrooculography, Proc. of the 6th International Conference on Pervasive Computing (Pervasive 2008), pages 19–37, Springer, 2008
- Bulling, A. et al.: Wearable EOG goggles: Seamless sensing and context-awareness in everyday environments, Journal of Ambient Intelligence and Smart Environments, 1(2):157-171, 2009
- Bulling, A. et al.: Eye Movement Analysis for Activity Recognition Using Electrooculography, IEEE Transactions on Pattern Analysis and Machine Intelligence, in press
- Bulling, A. et al.: Eye Movement Analysis for Activity Recognition, International Conference on Ubiquitous Computing (UbiComp 2009), pages 41–50, ACM Press, 2009.