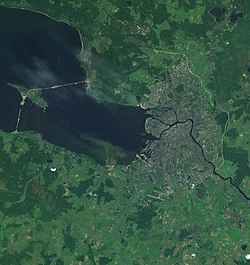
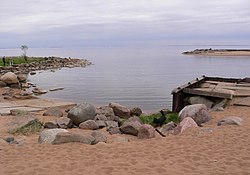
Saint Petersburg is a city and a federal subject located in the Northwestern Federal District of Russia. It stands at the mouth of the Neva River at the east end of the Gulf of Finland (part of the Baltic Sea).


The area of the city of Saint Petersburg proper is 605.8 km2 (233.9 sq mi). As a federal subject Saint Petersburg contains, besides Saint Petersburg proper, a number of towns (Kolpino, Krasnoye Selo, Kronstadt, Lomonosov, Pavlovsk, Petergof, Pushkin, Sestroretsk and Zelenogorsk), 21 municipal settlements, as well as rural localities. The total territory of the federal subject as of 2015[update] comprises 1439 km2.
The federal subject and city of Saint Petersburg is situated on the middle taiga lowlands along the shores of the Neva Bay of the Gulf of Finland, along the shores of the lower reaches of the River Neva itself and on the numerous islands of the river delta.
To the north of the city lies the Karelian Isthmus, a popular summer-resort area for citizens, while in the south Saint Petersburg crosses the Baltic-Ladoga Klint and meets the Izhora Plateau.
The elevation of Saint Petersburg ranges from the sea level to its highest point of 175.9 m (577 ft) at the Orehovaya hill in the Duderhof Heights in the south. However, the historical city center (except the area between Liteyny Prospekt and Smolnaya Embankment) is situated lower than 4 metres (13 ft) above sea level and has suffered from flooding about 300 times in its history. Floods in Saint Petersburg are triggered by long waves in the Baltic Sea, developing regularly under some meteorological conditions and amplified by favorable winds and by the shallowness of the Neva Bay. The most disastrous floods occurred in 1824 (4.21 m, 13 ft 10 in above sea level[1]), 1924 (3.80 m, 12 ft 6 in), 1777 (3.21 m, 10 ft 6 in), 1955 (2.93 m, 9 ft 7 in) and 1975 (2.81 m, 9 ft 3 in). The Saint Petersburg Dam, built to prevent floods, was completed in August 2011 after a lengthy period of construction beginning in 1979.[2]
Since the 18th century the terrain in the city centre has been steadily raised artificially, at some places by more than 4 metres (13 ft). The hydrology of the city center and the number of islands have also changed dramatically.
Besides the Neva and its distributaries, other important rivers of the federal subject of Saint Petersburg include:
The largest lake is Sestroretsky Razliv in the north, outside of the limits of Saint Petersburg proper. Lakhtinsky Razliv and Suzdal Lakes are smaller lakes within the northern limits of the city.
St. Petersburg's position on a latitude of about 60° N, less than seven degrees to the south of the Arctic Circle, leads to a huge variation in day length across seasons, ranging from 5 h 53 min to 18 h 50 min, and causes twilight to last all night in early summer, from June to mid-July – the celebrated phenomenon known as the white nights.
Islands
editThis section needs expansion. You can help by adding to it. (September 2016) |
Vasilyevsky Island is the largest island (not counting the unnamed artificial island formed by Obvodny Canal and Fontanka and Kotlin Island (the site of Kronstadt) in the Neva Bay), followed by Petrogradsky, Dekabristov and Krestovsky Islands. The latter, together with Yelagin and Kamenny Island, forms the so-called Kirovskiye islands, covered mostly by parks.
Other islands include:
- Aptekarsky Island
- Artillery Island
- Kanonersky Island
- New Holland Island
- Spassky Island, between the Fontanka, Moika, Griboyedov and Kryukov canals
- Zayachy Island (Hare Island), the site of the Peter and Paul Fortress
Climate
editSaint Petersburg experiences a humid continental climate of the warm summer subtype (Köppen: Dfb), due to the distinct moderating influence of the Baltic Sea cyclones. Summers are typically mild to hot, humid and quite short, while winters are long and cold but with frequent warm spells. The average winter minimum is about −9 °C (16 °F), and the record low temperature is −35.9 °C (−32.6 °F), recorded in 1883. Solid frozen ground is a normal part of winter there. The Neva River within the city limits usually freezes up in November–December (in 2007 and 2020 it did in late January only), while break-up occurs in April. On average there are 123 days with snow cover (stable from December to March), which reaches the average of 240 mm (9+1⁄2 in) by February. The frost-free period in the city lasts on average for about 135 days. There is some temperature variation within the city limits, and the city itself experiences a climate slightly warmer than its suburbs. Weather conditions are, however, quite variable all over the year.[3]
The highest temperatures of July and August were reached in 2010.
Average annual precipitation varies across the city, being about 600–750 mm per year on average and reaching maximum in late summer and in the north. Though this number is not high by itself, soil moisture is almost always excessive because of low evapotranspiration due to the cool climate. Relative humidity of air is also high (78% on average), and overcast is common throughout the year (165 days a year on average).
| Climate data for Saint Petersburg (1991–2020; extremes 1743–present) | |||||||||||||
|---|---|---|---|---|---|---|---|---|---|---|---|---|---|
| Month | Jan | Feb | Mar | Apr | May | Jun | Jul | Aug | Sep | Oct | Nov | Dec | Year |
| Record high °C (°F) | 8.7 (47.7) |
10.2 (50.4) |
15.3 (59.5) |
25.3 (77.5) |
33.0 (91.4) |
35.9 (96.6) |
35.3 (95.5) |
37.1 (98.8) |
30.4 (86.7) |
21.0 (69.8) |
12.3 (54.1) |
10.9 (51.6) |
37.1 (98.8) |
| Mean daily maximum °C (°F) | −2.5 (27.5) |
−2.4 (27.7) |
2.3 (36.1) |
9.5 (49.1) |
16.3 (61.3) |
20.5 (68.9) |
23.3 (73.9) |
21.4 (70.5) |
15.9 (60.6) |
8.7 (47.7) |
2.8 (37.0) |
−0.5 (31.1) |
9.6 (49.3) |
| Daily mean °C (°F) | −4.8 (23.4) |
−5.0 (23.0) |
−1.0 (30.2) |
5.2 (41.4) |
11.5 (52.7) |
16.1 (61.0) |
19.1 (66.4) |
17.4 (63.3) |
12.4 (54.3) |
6.2 (43.2) |
0.9 (33.6) |
−2.5 (27.5) |
6.3 (43.3) |
| Mean daily minimum °C (°F) | −7.2 (19.0) |
−7.6 (18.3) |
−4.0 (24.8) |
1.7 (35.1) |
7.2 (45.0) |
12.2 (54.0) |
15.3 (59.5) |
13.9 (57.0) |
9.4 (48.9) |
4.1 (39.4) |
−0.9 (30.4) |
−4.5 (23.9) |
3.3 (37.9) |
| Record low °C (°F) | −35.9 (−32.6) |
−35.2 (−31.4) |
−29.9 (−21.8) |
−21.8 (−7.2) |
−6.6 (20.1) |
0.1 (32.2) |
4.9 (40.8) |
1.3 (34.3) |
−3.1 (26.4) |
−12.9 (8.8) |
−22.2 (−8.0) |
−34.4 (−29.9) |
−35.9 (−32.6) |
| Average precipitation mm (inches) | 46 (1.8) |
36 (1.4) |
36 (1.4) |
37 (1.5) |
47 (1.9) |
69 (2.7) |
84 (3.3) |
87 (3.4) |
57 (2.2) |
64 (2.5) |
56 (2.2) |
51 (2.0) |
670 (26.4) |
| Average extreme snow depth cm (inches) | 15 (5.9) |
19 (7.5) |
14 (5.5) |
1 (0.4) |
0 (0) |
0 (0) |
0 (0) |
0 (0) |
0 (0) |
0 (0) |
3 (1.2) |
9 (3.5) |
19 (7.5) |
| Average rainy days | 9 | 7 | 10 | 13 | 16 | 18 | 17 | 17 | 20 | 20 | 16 | 10 | 173 |
| Average snowy days | 25 | 23 | 16 | 8 | 1 | 0.1 | 0 | 0 | 0.1 | 5 | 16 | 23 | 117 |
| Average relative humidity (%) | 86 | 84 | 79 | 69 | 65 | 69 | 71 | 76 | 80 | 83 | 86 | 87 | 78 |
| Mean monthly sunshine hours | 22 | 54 | 125 | 180 | 260 | 276 | 267 | 213 | 129 | 70 | 27 | 13 | 1,636 |
| Source 1: Pogoda.ru.net[4] | |||||||||||||
| Source 2: NOAA (sun 1961–1990)[5] | |||||||||||||
See also
editReferences
edit- ^ The level of flooding is usually measured at a point near Saint Petersburg Mining Institute, which is normally 11 cm (4 in) above sea level.
- ^ Нежиховский Р. А. Река Нева и Невская губа, Leningrad: Гидрометеоиздат, 1981.
- ^ See Historical weather records for Saint Petersburg (since 1932) and Historical weather in Saint Petersburg for further information.
- ^ "Pogoda.ru.net" (in Russian). Weather and Climate (Погода и климат). Retrieved 8 November 2021.
- ^ "Leningrad/Pulkovo Climate Normals 1961–1990". National Oceanic and Atmospheric Administration. Retrieved 10 December 2019.
Further reading
edit- Jones, P. D. & D. H. Lister (2002). The Daily Temperature Record for St. Petersburg (1743–1996). Climatic Change 53 (1-3), 253–267.
- Sunset and Sunrise in St. Petersburg during the months of May, June, July, August, September .