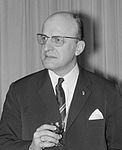
General elections were held in Belgium on 26 March 1961.[ 1] Christian Social Party , which won 96 of the 212 seats in the Chamber of Representatives and 47 of the 106 seats in the Senate .[ 2] [ 3] provincial councils were also held.
1961 Belgian general election
First party
Second party
Third party
Leader
Théo Lefèvre
Léo Collard
Roger Motz
Party
Christian Social
Socialist
Liberal
Leader since
Candidate for PM
1959
1958
Last election
104 seats, 46.50%
80 seats, 35.79%
20 seats, 11.05%
Seats won
96
84
20
Seat change
Popular vote
2,182,642
1,933,424
649,376
Percentage
41.46%
36.72%
12.33%
Swing
Fourth party
Fifth party
Sixth party
Leader
Frans Van der Elst
Ernest Burnelle
Jean-Marie Evrard
Party
VU
Communist
RN
Leader since
1955
1954
1959
Last election
1 seat, 1.98%
2 seats, 1.89%
New
Seats won
5
5
1
Seat change
New
Popular vote
182,407
162,238
42,450
Percentage
3.46%
3.08%
0.81%
Swing
New
Chamber seat distribution by constituency
Prior to the elections, the centre-right government of the Christian Social and Liberal Party led by Gaston Eyskens pushed through austerity measures with a law known as the Eenheidswet or Loi Unique heavy strikes in the preceding weeks , especially in Wallonia. After the elections, the Christian Democrats formed a new government with the Socialist Party instead of the Liberal Party, with Théo Lefèvre as Prime Minister.
Party Votes % Seats +/– Christian Social Party 2,182,642 41.46 96 –8 Belgian Socialist Party 1,933,424 36.72 84 +4 Liberal Party 649,376 12.33 20 0 People's Union 182,407 3.46 5 +4 Communist Party of Belgium 162,238 3.08 5 +3 National Rally 42,450 0.81 1 New Independent Party 33,174 0.63 0 New National Union of Independents 12,252 0.23 0 New National Party 4,375 0.08 0 New Liberal dissidents3,956 0.08 0 New Walloon Unity 3,466 0.07 0 New Alleenstaande 3,101 0.06 0 New Zelfstandig 2,307 0.04 0 New Francophone Bloc 1,824 0.03 0 New Gekavemus 604 0.01 0 New Independent Workers 551 0.01 0 New Universal People 480 0.01 0 New EC Group 154 0.00 0 New Independents 46,244 0.88 1 +1 Total 5,265,025 100.00 212 0 Valid votes 5,265,025 94.46 Invalid/blank votes 308,815 5.54 Total votes 5,573,840 100.00 Registered voters/turnout 6,036,165 92.34 Source: Belgian Elections[ 4]
Party Votes % Seats +/– Christian Social Party 2,200,323 42.12 47 –6 Belgian Socialist Party 1,924,605 36.84 45 +5 Liberal Party 637,922 12.21 11 +1 Communist Party of Belgium 163,576 3.13 1 0 People's Union 159,096 3.05 2 +2 National Movement 26,211 0.50 0 New Independent Party 21,421 0.41 0 New National Union of Independents 13,284 0.25 0 New Liberal dissidents7,711 0.15 0 New National Rally 5,425 0.10 0 New National Party 4,457 0.09 0 New Walloon Unity 3,478 0.07 0 New Francophone Bloc 1,947 0.04 0 New Other parties 18,405 0.35 0 – Independents 36,646 0.70 0 0 Total 5,224,507 100.00 106 0 Valid votes 5,224,507 93.73 Invalid/blank votes 349,475 6.27 Total votes 5,573,982 100.00 Registered voters/turnout 6,036,165 92.34 Source: Nohlen & Stöver, Belgian Elections[ 5]


