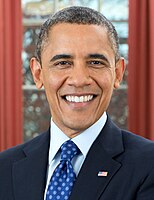
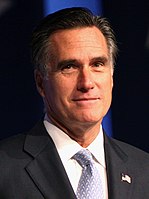
This section is empty. You can help by
adding to it .
(June 2022 )
2012 Maryland Republican presidential primary
County results Congressional district results Romney: 30–40% 40–50% 50–60%Santorum: 40–50% 50–60%
The Republican primary took place on April 3, 2012, the same day as the District of Columbia Republican primary and the Wisconsin Republican primary .[ 3]
Green National Convention, Maryland Delegate Vote[ 6] [ 7]
Candidate
Delegates
Percentage
Jill Stein
5
83%
Roseanne Barr
1
17%
Others
-
-
Total
6
100%
Libertarian National Convention, Maryland Delegate Vote [ 8]
Candidate
Delegates
Percentage
Gary Johnson
9
64%
R. Lee Wrights
4
29%
Carl Person
1
7%
Others
-
-
Total
14
100%
County
Barack Obama
Mitt Romney
Various candidates
Margin
Total votes cast
#
%
#
%
#
%
#
%
Allegany
9,805
32.85%
19,230
64.42%
815
2.73%
-9,425
-31.57%
29,850
Anne Arundel
126,635
48.68%
126,832
48.75%
6,688
2.57%
-197
-0.07%
260,155
Baltimore
220,322
57.26%
154,908
40.26%
9,552
2.48%
65,414
17.00%
384,782
Baltimore City
221,478
87.19%
28,171
11.09%
4,356
1.71%
193,307
76.10%
254,005
Calvert
20,529
45.10%
23,952
52.62%
1,037
2.28%
-3,423
-7.52%
45,518
Caroline
4,970
37.21%
8,098
60.63%
289
2.16%
-3,128
-23.42%
13,357
Carroll
27,939
31.92%
56,761
64.84%
2,836
3.24%
-28,822
-32.92%
87,536
Cecil
16,557
38.98%
24,806
58.39%
1,117
2.63%
-8,249
-19.41%
42,480
Charles
48,774
64.84%
25,178
33.47%
1,270
1.69%
23,596
31.37%
75,222
Dorchester
7,257
46.99%
7,976
51.64%
211
1.37%
-719
-4.65%
15,444
Frederick
55,146
47.09%
58,798
50.21%
3,171
2.71%
-3,652
-3.12%
117,115
Garrett
3,124
23.74%
9,743
74.05%
290
2.20%
-6,619
-50.31%
13,157
Harford
49,729
39.48%
72,911
57.89%
3,314
2.63%
-23,182
-18.41%
125,954
Howard
91,393
59.69%
57,758
37.72%
3,957
2.58%
33,635
21.97%
153,108
Kent
4,842
48.89%
4,870
49.17%
192
1.94%
-28
-0.28%
9,904
Montgomery
323,400
70.92%
123,353
27.05%
9,239
2.03%
200,047
43.87%
455,992
Prince George's
347,938
89.73%
35,734
9.22%
4,072
1.05%
312,204
80.51%
387,744
Queen Anne's
8,556
34.38%
15,823
63.58%
509
2.05%
-7,267
-29.20%
24,888
St. Mary's
19,711
41.22%
26,797
56.03%
1,316
2.75%
-7,086
-14.81%
47,824
Somerset
5,240
50.39%
5,042
48.49%
117
1.13%
198
1.90%
10,399
Talbot
8,808
43.05%
11,339
55.42%
312
1.53%
-2,531
-12.37%
20,459
Washington
25,042
39.90%
36,074
57.48%
1,639
2.61%
-11,032
-17.58%
62,755
Wicomico
19,635
46.46%
21,764
51.50%
860
2.04%
-2,129
-5.04%
42,259
Worcester
11,014
40.17%
15,951
58.17%
455
1.66%
-4,937
-18.00%
27,420
Totals
1,677,844
61.97%
971,869
35.90%
57,614
2.13%
705,975
26.07%
2,707,327
County Flips: Democratic Hold
Gain from Republican
Republican Hold
Gain from Democratic
Counties that flipped from Democratic to Republican Counties that flipped from Republican to Democratic By congressional district
edit
Obama won 7 of the state's 8 congressional districts.[ 17]
^ "2012 Presidential General Election - Statewide Voter Turnout by County and Party" . elections.maryland.gov .^ "Dave Leip's Atlas of U.S. Presidential Elections" . uselectionatlas.org . Retrieved March 31, 2023 .^ "Maryland Republican Primary" . The New York Times . Retrieved June 8, 2015 .^ "2012 Primary Election Results" (PDF) . Mississippi Republican Party. March 29, 2012.^ "maryland Republican Primary - Election Results - Election 2012" . The New York Times .^ "2012 primaries - Jill Stein for President" . www.jillstein.org . Archived from the original on February 15, 2015. Retrieved January 11, 2022 .^ Archived at Ghostarchive and the Wayback Machine : "Green Party Presidential Convention State by State Delegation Vote" . YouTube
^ "2012 Libertarian National Convention" (PDF) . Libertarian Party. May 3–6, 2012.^ "Huffington Post Election Dashboard" . HuffPost the original on August 13, 2013.^ "America's Choice 2012 Election Center: CNN Electoral Map" . CNN the original on January 19, 2013.^ "Election 2012 - The Electoral Map: Building a Path to Victory" . The New York Times the original on July 8, 2012.^ "2012 Presidential Election Results" The Washington Post . Archived from the original on July 26, 2012.^ "RealClearPolitics - 2012 Election Maps - Battle for White House" . Archived from the original on June 8, 2011.^ "PROJECTION: OBAMA WILL LIKELY WIN SECOND TERM" .^ "Nate Silver's political calculations predict 2012 election outcome" .^ "Maryland State Board of Elections" . Retrieved November 10, 2012 .^ "Maryland 2012 pres-by-cd" .


