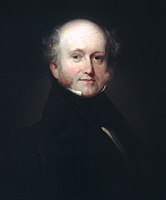
The 1836 United States presidential election in Missouri took place between November 3 and December 7, 1836, as part of the 1836 United States presidential election. Voters chose four representatives, or electors to the Electoral College, who voted for President and Vice President.
| ||||||||||||||||||||||||||
| ||||||||||||||||||||||||||
 County Results
| ||||||||||||||||||||||||||
Missouri voted for the Democratic candidate, Martin Van Buren, over Whig candidate Hugh White. Van Buren won Missouri by a margin of 19.96%.
Results
edit| 1836 United States presidential election in Missouri[1] | |||||
|---|---|---|---|---|---|
| Party | Candidate | Votes | Percentage | Electoral votes | |
| Democratic | Martin Van Buren | 10,995 | 59.98% | 4 | |
| Whig | Hugh White | 7,337 | 40.02% | 0 | |
| Totals | 18,332 | 100.0% | 4 | ||
Results By County
edit| County | Martin Van Buren
Democratic |
Hugh Lawson White
Whig |
Total Votes Cast | ||
|---|---|---|---|---|---|
| # | % | # | % | ||
| Barry | 55 | 100.00% | 0 | 0.00% | 55 |
| Benton | 75 | 94.94% | 4 | 5.06% | 79 |
| Boone | 567 | 44.26% | 714 | 55.74% | 1,281 |
| Callaway | 616 | 58.00% | 446 | 42.00% | 1,062 |
| Cape Girardeau | 435 | 74.49% | 149 | 25.51% | 584 |
| Carroll | 142 | 81.14% | 33 | 18.86% | 175 |
| Chariton | 188 | 69.12% | 84 | 30.88% | 272 |
| Clay | 347 | 55.17% | 282 | 44.83% | 629 |
| Clinton | 129 | 73.30% | 47 | 26.70% | 176 |
| Cole | 576 | 88.75% | 73 | 11.25% | 649 |
| Crawford | 86 | 59.31% | 59 | 40.69% | 145 |
| Franklin | 238 | 64.15% | 133 | 35.85% | 371 |
| Gasconade | 115 | 58.67% | 81 | 41.33% | 196 |
| Greene | 140 | 92.72% | 11 | 7.28% | 151 |
| Howard | 619 | 63.62% | 354 | 36.38% | 973 |
| Jackson | 489 | 72.77% | 183 | 27.23% | 672 |
| Jefferson | 138 | 60.79% | 89 | 39.21% | 227 |
| Johnson | 240 | 75.47% | 78 | 24.53% | 318 |
| Lafayette | 294 | 64.05% | 165 | 35.95% | 459 |
| Lewis | 298 | 60.20% | 197 | 39.80% | 495 |
| Lincoln | 236 | 46.18% | 275 | 53.82% | 511 |
| Madison | 109 | 66.46% | 55 | 33.54% | 164 |
| Marion | 338 | 49.63% | 343 | 50.37% | 681 |
| Monroe | 317 | 53.10% | 280 | 46.90% | 597 |
| Montgomery | 92 | 35.25% | 169 | 64.75% | 261 |
| Morgan | 216 | 80.90% | 51 | 19.10% | 267 |
| Perry | 173 | 91.05% | 17 | 8.95% | 190 |
| Pettis | 161 | 71.56% | 64 | 28.44% | 225 |
| Pike | 415 | 50.61% | 405 | 49.39% | 820 |
| Polk | 80 | 55.17% | 65 | 44.83% | 145 |
| Pulaski | 230 | 82.44% | 49 | 17.56% | 279 |
| Ralls | 151 | 55.31% | 122 | 44.69% | 273 |
| Randolph | 399 | 67.17% | 195 | 32.83% | 594 |
| Ray | 221 | 48.79% | 232 | 51.21% | 453 |
| Ripley | 70 | 97.22% | 2 | 2.78% | 72 |
| Rives | 108 | 72.97% | 40 | 27.03% | 148 |
| Saline | 178 | 56.87% | 135 | 43.13% | 313 |
| Shelby | 63 | 67.02% | 31 | 32.98% | 94 |
| St. Charles | 237 | 45.66% | 282 | 54.34% | 519 |
| St. Francois | 137 | 48.75% | 144 | 51.25% | 281 |
| St. Louis | 681 | 44.69% | 843 | 55.31% | 1,524 |
| Ste. Genevieve | 97 | 67.36% | 47 | 32.64% | 144 |
| Stoddard | 70 | 80.46% | 17 | 19.54% | 87 |
| Warren | 76 | 33.63% | 150 | 66.37% | 226 |
| Washington | 311 | 55.94% | 245 | 44.06% | 556 |
| Totals | 10,953 | 59.55% | 7,440 | 40.45% | 18,393 |
See also
editNotes
edit- ^ No returns from Cooper, New Madrid, Scott, Van Buren, or Wayne have been located.
References
edit- ^ "1836 Presidential General Election Results - Missouri". U.S. Election Atlas. Retrieved April 15, 2013.
- ^ Dubin, Michael J. United States Presidential Elections. 1788-1870: The Official Results by County and State. ISBN 978-0-7864-6422-7.

